Simulation Improves Service and Resource Allocation at an Automotive Garage
Proceedings of the International Conference on Industrial Engineering and Operations Management Sao Paulo, Brazil, April 6-8, 2021
Wenqi Deng, Yang Yang, Di Zhao, and Edward J Williams
Business Analytics, College of Business, University of Michigan – Dearborn Dearborn, MI, 48126, USA
ABSTRACT
Discrete-event process simulation historically began its now long and distinguished “career” in support of manufacturing operations, ranging from assembly lines to make-to-order operations. From than auspicious beginning, it has expanded its usage to many other fields, such as warehousing, public transport (e.g., airports, bus terminals, railroads…), health care delivery (e.g., hospitals, clinics, urgent care centers, dental practices…), government functions (e.g., welfare administration,timingoftrafficlights,courthouses…),andtheserviceindustry. Serviceindustryapplicationsofsimulation have included restaurants, retail stores, hotels, and drive-through oil change centers. In this paper, we describe the important and productive role of simulation in improving the service performance metrics and resource allocation within an automotive service center.
KEYWORDS
Discrete-event process simulation, Automotive repair, Service industry, Resource utilization, Queueing system performance metrics
1. INTRODUCTION
The first commercial uses, and still among the most numerous uses, of discrete-event process simulation have been in the manufacturing sector of the economy. There, simulation first and dramatically showed its abilities to identify bottlenecks, evaluate proposals for eliminating them, improve and level usage of scarce and/or expensive resources, and improve performance metrics such as total output, queue lengths, and time waiting in queues. As a result of and spurred by these successes, simulation usage rapidly expanded into the warehousing sector, health care (particularly hospitals), government work, transportation networks, and service industries, as documented by Greasley (2005). Cepera and Konrad (2019) applied simulation to governance of complex transportation systems and traffic jams in Germany. Many examples of simulation analyses applied to service industries have been documented in the literature. For example, Villarreal-Navarro et al. (2017) applied simulation analysis to reduce shoppers’ exasperation at empty shelves at a network of Mexican convenience stores. Call centers are a frequent service-industry application of simulation, as recognized by Mathew and Nambier (2013). Williams et al. (2005) applied simulation to improve operations and traffic flow at a drive-through oil- change center.
The remainder of this paper is organized as follows: The next section presents an overview of the services provided by and the operations of the repair garage. Next, we describe the data required by the model and describe the collection of those data. Next, we present the process of building, verifying, and validating the simulation model. Subsequently, we describe the results provided by the model and our analysis of them, leading to recommendations provided to the garage managers and owners. We conclude with a summary of the project and indications of likely future work.
2. OVERVIEW OF REPAIR GARAGE SERVICES AND OPERATIONS
Servicing consumers’ vehicles is a huge market worldwide, with three types of participants: Dealers who also sell vehicles, independent repair shops, and a miscellaneous category including, for example, filling stations and specialty shops, as described by Horowitz and Shilling (1989). The automotive service center studied in this simulation work is of the second category; it was opened in 2017, and is located near the economic development district of Beijing, the capital of China. This garage enjoys, has earned, and very much wishes to maintain, an excellent reputation for repair services performed with integrity and quality (in sharp contrast to worldwide stereotypes of automotive repair shops). The center operates five days a week (Monday through Friday), opening each day at 8am. After 4pm, no new arrivals are accepted for service that day, but the mechanics and other service personnel stay on duty until almost all (exception noted below) vehicles arriving that day have received service. Therefore, a customer (e.g., an employee in a nearby office building) can and routinely does drive his or her vehicle (drivable but in need of repairs and/or routine maintenance) to the garage, leave it there, and continue to the day’s work via a ride-sharing colleague, a municipal bus, or a taxicab. Such a customer then expects to return to the garage late in the afternoon and reclaim his or her personal vehicle.
Three mechanics provide diagnostic and repair services such as changing oil, replacing batteries, correcting mechanical problems, and repairing collision damage. Those few vehicles which have suffered severe collision damage hav e to remain at the garage more than one day; the customer is alerted to that necessity before service begins. One assistant drives or moves the vehicles between the customer interface of the garage and the diagnostic and repair bays. This assistant, as an amenity, washes the exterior of the vehicle before returning it to the customer. Operation of independent auto repair shops such as this one involves many nuances, as documented by Magro and Cook (1981). As this simulation analysis began, the busy season was approaching (more driving in the springtime, and winter is hard on vehicles); additionally, the long- term trend of business is upward (irrespective of seasonal variation) due to increasing density of population. The manager expressed the following concerns to be addressed by the analysis:
- How can the utilization of the mechanics be maintained in the 70%-80% range – e.g., hiring more mechanics, increasing the capacity of the diagnostic station, increasing the capacity of the repair station, or some combination of these measures?
- How can the time-in-system be kept low? – particularly the probability a vehicle is unexpectedly not ready when a customer returns late in the afternoon?
- How can the probability the mechanics need to work beyond 6pm be kept very low?
The simulation analysts agreed to address these management questions and apprised the client of data collection that would be required to conduct an accurate and productive study.
3. DATA COLLECTION AND ANALYSIS
Based on observation of garage operations over several days (the analysts deliberately picked three different weekdays, as opposed to, for example, three consecutive Mondays), plus advice from client managers, vehicle service was divided into these four categories:
- Routine maintenance, for example “Please change the oil, check the battery, and check the pressure in the tires”
- Routine repair, for example “Please replace the dying battery; I had the battery jumped this morning to drive the car here” or “Please patch or replace the tire which repeatedly loses pressure”
- Small accident, for example “Please replace the dented front bumper”
- Moderate accident, for example “Please replace the dented passenger door, which won’t even open since the collision”
The garage management openly acknowledges that this garage does not cater to a category which might be called “Severe accident;” as a practical guideline, the garage does not receive vehicles so badly damaged that they must be towed in. Such potential clients are referred to manufacturers’ repair sites or specialized collision shops.
Very fortunately and commendably, the garage management had an archive of one year’s data. Raw data was examined with the Palisade @RISK® software as described by Clemen and Reilly (2014). These analyses led to modeling customer arrivals as a Poisson process, and modeling service times at the various stations with triangular or uniform distributions (except for the customer sign-in, which was modeled as a constant two minutes). The proportions of the various types of customers were modeled according to Table 1, below:

4. MODEL DEVELOPMENT, VERIFICATION AND VALIDATION
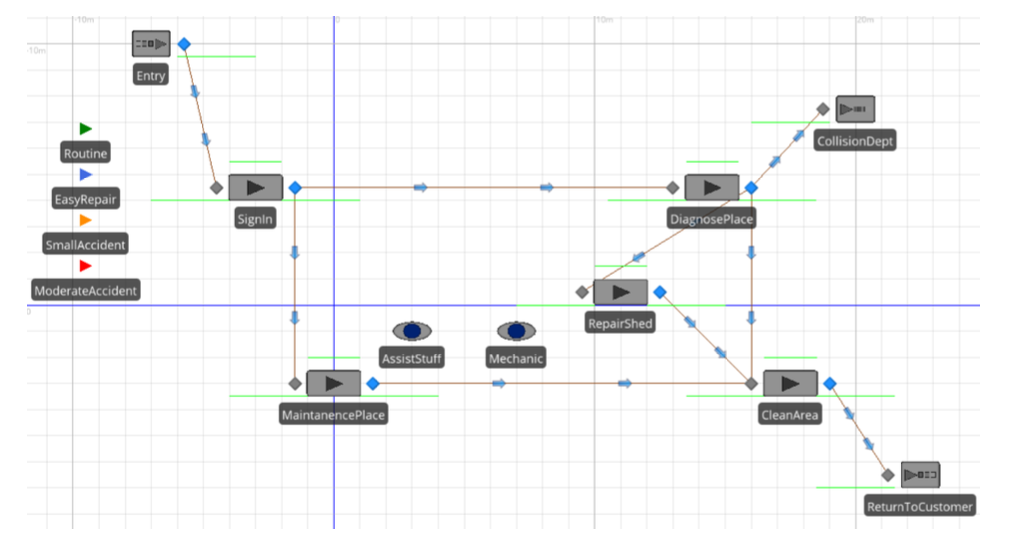
Members of the project team concurred in the choice of the Simio® software [SIMulation with Intelligent Objects], well- documented in both Prochaska and Thiesing (2017) and Smith, et al. (2018) to construct a model of the operations at this automotive service garage. Simio® provides constructs such as the Server (to model, for example, the customer sign-in area, the diagnostic bays, and the service bays), the Resource (clerks, mechanics, and their assistants), and the Entity (e.g., representing routine maintenance requests, routine repairs, small accidents, and moderate accidents). A partial two- dimensional screen shot of this model is shown in Figure 1 on the next page. This animation provides useful cues; for example, Servers and Resources are gray when idle, green when in use, and white when off-shift. The recent work Robinson (2014) describes the value of such animation, while stressing that animation supplements, but does not replace, verification and validation. From this screen, a three-dimensional animation is only two clicks away.
Verification and validation of the model used the following traditional and time-tested techniques described in Sturrock (2018):
- Meetings (structured walkthroughs with explicit agendas based on detection or suspicion of problems) among the project team
- Sending one entity (each of the four entity types described above was chosen in turn) through the model and tracking, on a trace provided by the software on request, every step taken by that entity
- Replacement (temporarily) of all expressions representing stochastic variation within the model by constants, followed by arithmetic checks
- Checking that every routing path placed in the model has non-zero traffic – a route with zero traffic during an entire run was either indicative of a logic error, or was unnecessary clutter and therefore removed (the verification process encountered both of these situations)
- Common-sensical direction of change (e.g., do queue lengths and waiting times increase when the cycle time of a machine is increased — do they decrease when the capacity of a machine is increased?)
The usual errors were detected and corrected. Indeed, one error resulted in vehicles needing various levels of repairs either going to locations in the wrong order or staying there for the wrong durations of time. Another error, a routing logic error, was exposed by noticing that one of the routes in the model was never used (fourth item in the list above). After correction of these errors, a “capstone” validation test was run. This test entailed telling the simulation model to put “last Thursday’s” actual arrivals into the system (Simio® provides an “Arrival Table” which makes this specification routine) and observing the results. Those results agreed with the actual events of that day within 3.5%, greatly enhancing the model’s credibility with the managers of the service garage.
5. EXPERIMENTATION AND RESULTS
In keeping with actual policy at the service garage (services and repair tasks started anew daily), the model was run as a terminating system, hence zero warm-up time. Each replication represented one day’s work, with an opening time of 8am and a closing time after 4pm (that is, the doors were closed to potential customers at 4pm, after which the model “ran until empty” – until all work accepted that day was completed. Each of six scenarios (the first representing current conditions at the garage) was run for 20 replications. The variance reduction technique (VRT) of common random numbers (CRNs) was used (Nakayama 2003). Simio® conveniently accommodates this technique by allowing the specification of different random number streams for interarrival times, cycle times, times to next failure, and repair times, as was done in this mo del. Confidence levels for estimation of performance metrics were taken at 95%, and similarly for the confidence level of testing the null hypothesis of equal performance of any two scenarios.
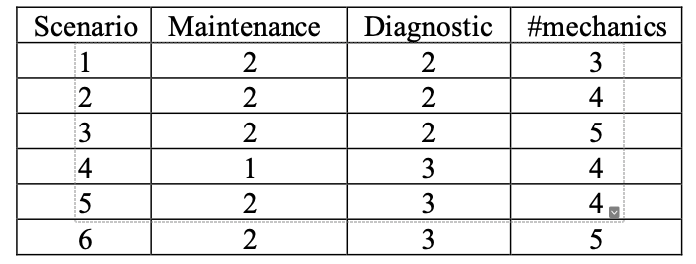
Within the scenarios, the maintenance bay capacity, diagnostic bay capacity, and number of mechanics were varied as shown in Table 2 below:
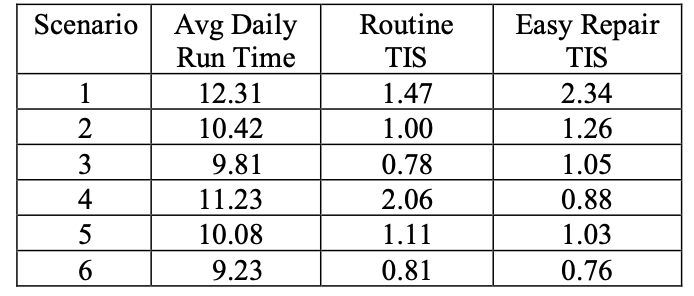
In each of these scenarios, Simio® was asked to capture key performance metrics: utilizations of the mechanics, the maintenance bay(s), the diagnostic bays, and the two repair bays; the average run time until empty, and average waits for routine maintenance, easy repairs, and small accident repairs. The results of greatest consequence to the garage managers and owners are shown below in Table 3 (all times in hours, “TIS” = “Time in System”):
6. CONCLUSIONS AND FUTURE WORK
Given these results, the simulation analysis team presented two highly promising choices to the garage management:
- Recruit one more mechanic, keeping other specifications unchanged.
- Recruit two more mechanics, keeping other specifications unchanged.
Recommendation 1 was predicted to provide the following improvements:
- Mechanic utilization would decrease from 91% to 80% (often considered “the ideal percent busy time” in operations research).
Time in system for all types of work would noticeably decrease: routine TIS from 1.47 hours to 1.00 hours; easy repair from 2.34 to 1.26 hours; small accident from 3.50 to 2.23 hours. - Average run time would decrease from 12.31 hours (work done about 8:20pm) to 10.42 hours (work done before 6:30pm).
Recommendation 2 was predicted to provide the following improvements:
- Mechanic utilization would decrease from 91% to 68% (somewhat lower than usually desired).
- Time in system for all types of work would significantly decrease: routine TIS from 1.47 hours to 0.78 hours; easy repair from 2.34 to 1.05 hours; small accident from 3.50 to 1.98 hours.
- Average run time would decrease from 12.31 hours (work done about 8:20pm) to 9.81 hours (work done shortly before 6pm), representing nearly two fewer hours of work daily.
The garage management decided to implement the first recommendation – its advantages were better utilization of the skilled mechanics and its lower cost, since one fewer new mechanic would be hired. The mechanics (including the newly hired one) were moderately pleased at the prospect of finishing their daily work, on average, markedly sooner. This recommendation has now been in effect several months, and the predictions of the analysis have been fulfilled.
ACKNOWLEDGMENTS
The authors gratefully acknowledge the cooperation and assistance of the automotive garage managers and workers in providing data, explaining details of the plant’s operation, and specifying the performance metrics of primary concern.
REFERENCES
Cepera, K. and Konrad, J. 2019. Simulation governance of complex transportation systems. In Proceedings of the Conference of the European Social Simulation Association. September 23-37, 2019, Mainz (Germany).
Clemen, R. T. and Reilly, T. 2014. Making hard decisions with DecisionTools®, 3rd edition. South-Western, Cengage Learning, Mason, Ohio.
Greasley, A. 2005. Increasing the use of simulation in business. Proceedings of the 2005 Summer Computer Simulation Conference, 400-405. July 24-28, 2005. Cherry Hill, New Jersey (United States of America).
Horowitz, D. and Shilling, D. 1989. The Business of Business. Harper & Row, Publishers, New York, New York.
Magro, W. R. and Cook, W. A. 1981. What you always wanted to know about auto repair shops but were afraid to ask— A national survey of owner/operators, mechanics and consumers. Proceedings of the 1981 SAE International Conference and Exhibition, Society of Automotive Engineers Technical Paper 810056.
Mathew, B. and Nambiar, M. K. 2013. A tutorial on modelling call centres using discrete event simulation. Proceedings of the 27th European Conference on Modelling and Simulation, 315-321. May 27-30, 2017, Ålesund (Norway).
Nakayama, M., 2003. Analysis of simulation output. Proceedings of the 2003 Winter Simulation Conference, Volume 1,49-58. December 7-10, New Orleans, Louisiana (United States of America).
Prochaska, K. and Thiesing, R. 2017. Introduction to Simio. Proceedings of the 2017 Winter Simulation Conference, 4410-4419. December 3-6, Las Vegas, Nevada (United States of America).
Robinson, S. 2014. Discrete-event Simulation – a primer. In Discrete-Event Simulation and System Dynamics for Management Decision Making, eds. S. Brailford, L. Churilov, and B. Dangerfield. John Wiley & Sons, Incorporated,New York, New York.
Smith, J., Sturrock, D., and Kelton, W. 2018. Simio and Simulation: Modeling, Analysis, Applications. 5th ed. Sewickley, Pennsylvania (United States of America): Simio LLC.
Villarreal-Navarro, A., Vazquez-Preciat, K., Camacho-Alcala, L., and Villarreal, B. 2017. Increasing on-shelf availability of a Mexican convenience store network. Proceedings of the Seventh International Conference on Industrial Engineering and Operations Management, 10-16. April 11-13, 2017, Rabat (Morocco).
Williams, E. J., Clark, J. A., Bales, J. D., and Amodeo, R. M. 2005. Simulation improves staffing procedure at an oil change center. Proceedings of the 19th European Conference on Modelling and Simulation, 309-314. June 1-4, 2005, Rīga (Latvia).
Your Partner in Productivity Improvement
Want to speak with one of our Industrial Engineering, Reality Caputre, or Simulation Experts? Contact us via the form below!
We look forward to helping you achieve your goals.
Recent posts
