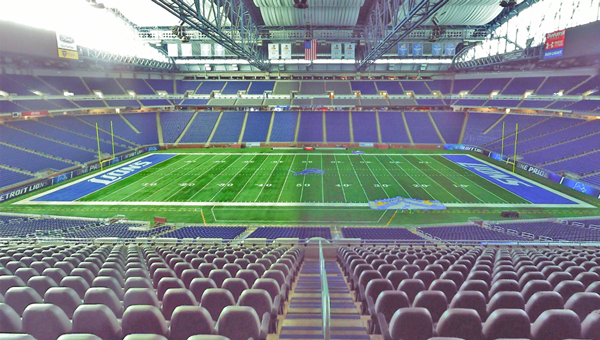
Sports and Entertainment digital twin technology (reality capture) are changing the way venues are planned, renovated, and maintained. In this article we will explore how our laser scan to point cloud and 3D rendering capabilities provided extreme value to the commissioned architecture firm that redesigned the Ford Field Concourse. We’ll also show you how to expand that scope to better plan and execute large scale project with dynamic computer simulation, as opposed to traditional static computer simulation. These methods not only apply to sports and entertainment digital twins, but large complexes and cities as well.
Detroit – A Little History
Located in Downtown Detroit, Ford Field sits at the heart of a bustling city that has found a comeback over the last 20 years. With the closure of the Pontiac Silverdome in 2002, the Detroit Metro area found a new sports venue with Ford Field breaking ground in 1999 as an early piece to the revitalization puzzle. Various initiatives have since restored historical sites across the city, driven by the influx of corporate interests which led to the development of Little Caesars Arena and a surge in career opportunities bringing Millennials to live and work in Midtown.
With a maximum capacity of 80,000 attendees in the stadium, Ford Field played host to the 2006 Super Bowl XL, and will support the upcoming NFL Draft, revisiting Ford Field in Spring of 2023. Ford Field’s popularity and technology have proven to be a major asset to the city. After 10 years of service and high traffic, the main concourse, food vendor stalls, and premium experience suites of Ford Field were commissioned to be redesigned in 2017.
Ford Field Concourse
In preparation for the complete redesign and fit-out of the concourse, the lead architecture design firm required a solid CAD foundation to work from, including precise measurements and strong visualizations of the space as it stood. With a digital twin of the existing space, the design architects could execute design validation, build construction documents, and plan interior fit-out of all the suites and the concourse. At the onset of the project, there was no working data to initiate the project.
Our team was contracted to assist with developing a digital twin of the concourse, including data capture with laser scanning, and training the existing architectural firm team on how to best utilize and translate the data sets into a 3D BIM model.
Often when a laser scan project is launched, the team utilizing the digital twin technology may not always have the capability or time to develop the 3D model on their own. Luckily the team with the architectural firm was well-versed in 3D modeling, only requiring PMC to manage the massive amount of data sets and teach them how to translate the point cloud into the modeling software.
Data Capture
1500 scan plan capture locations 5 night shifts on-site 40 hours to train the design team
At the onset of the project, we established a scope of work that entailed our process:
Design team scope discovery, venue walkthroughs, and planning with venue management
The site scan plan, which ensured efficient scanner placement at strategic vantage points and data completeness
Working with the venue for logistics and time considerations as an active site to the public
Coordination with the Project Managers at the architectural firm for design validation and to deliver data in manageable portions
Training their design teams to convert and utilize the data in Revit 3D Modeling software
The Ford Field Concourse project had a large scan registration consisting ofover 1500 scans. It was therefore critical that we provided manageable amounts of data sets for them to utilize during their process. We were also responsible for ensuring the design firm received the appropriate data during critical phases of their design schedules.
After this was completed, new renderings of fixtures, displays, furniture, lighting, and other furnishings could be added for the new interiors by the design architects’ own team in Revit.
Imagine the Possibilities
With fully rendered3D models of sports and entertainment venues, it is possible to show prospective tenants what the premium suite redesign will look like before it is completed. Additionally, virtual reality and augmented reality experiences (VR/AR Mixed) can be created to give the consumer a very realistic representation of the venue’s future, enabling early sales and faster return on investment.
Virtual Reality and Augmented Reality Experiences
When a scan is completed of the entire stadium, not just of the concourse, the customer experience is amplified to the extent that they can see an exact representation of what their view is going to be before they purchase a ticket or season pass.
If the venue utilizes the data setsfurther, they can add more value by delivering concessions right to their attendee’sseat with mobile apps. Using artificial intelligence we can protect customers’ identities using facial recognition software to blur their appearance.
From a maintenance perspective, the digital twin can capture the structure and components of the venue to track replacement parts, repairs, prepare maintenance schedules, and plan and implement smart technology that remote controls lighting and hydraulics. Developing and maintaining a representation of the IoT in a sports and entertainment venue creates more efficiency and enables the longevity of the venue in our ever-changing world of technology.
Digital twins can also enable pedestrian dynamic planning and optimization. Imagine having a real representation of how 80,000 people move through a large venue to reach concessions, ticket sales, vomitoriums, restrooms, and luxury suites, and even evacuation plans as well. This enables design and engineering teams to plan more effectively and venue management to ensure training is effective for the safety of their teams and the public at-large.
Reality capture is a term used to convey a sense of completeness in terms of data that Digital Twins provide to Architectural Engineering and Construction firms, Venue Organizers and Owners, Site Planners, and even Municipalities. Having the ability to gather reality in a point cloud and transferring the data into a 3D model allows for designers and engineers to accurately depict potential futures without the time and cost of gathering measurements by hand or relying on blueprints.
Specifically digital twins can help avoid costly mistakes, reduce material costs, expedite project timelines, and optimize the spaces we live and work in.
Optimizing pedestrian flow and guest experience at NASA’s Kennedy Space Center.
Planning zoo enclosure formats and location, establishing pedestrian flows through the park.
Scanning for the restoration of historic features. High detail meshing of laser scans to visualize current and future states.
Scanning and model development to facilitate new sports betting:
The scope and scale of reality capture is only limited to our own perception of what is possible. Not limited to sports and entertainment venues, Smart Cities and Smart Complexes are achieved through reality capture and dynamic simulation processes as well.
Determine the Need for Reality Capture
When planning to integrate reality capture and digital twins into your project, it will likely become necessary to speak with an expert in these areas to determine what your needs are to achieve your objectives, unless you have members of your own staff that are capable of point cloud capture, 3D rendering knowledge, and dynamic simulation.
Even so, experts in these fields may not understand the full scope of what can be achieved through a complete digital twin of your scenario. This is the reason so many companies, municipalities, and even other engineering and architecture firms rely on specialists like ours.
Reach out to us via the form below to schedule a time to speak with our reality capture and digital twin technology experts to help identify what the possibilities are for your initiatives.
Reach out to us with the form below to get a better sense of what a dynamic digital twin technology can do for you:
INTEGRATION OF SIMULATION, STATISTICAL ANALYSES, AND OPTIMIZATION INTO THE DESIGN AND IMPLEMENTATION OF A TRANSFERLINE MANUFACTURING SYSTEM
Scott J. Suchyta Edward J. Williams
Department of Industrial and Systems Engineering, University of Michigan – Dearborn
2261 Engineering Complex, 4901 Evergreen Road, Dearborn, Michigan 48128
Computer Aided Analytical Engineering, Ford Motor Company
24500 Glendale Drive, Redford, Michigan 48239-2698
ABSTRACT
Achieving efficiency of initial investment and operational expense with respect to a transfer-line manufacturing system presents many challenges to the industrial or process engineer. In this paper, we describe the integration of simulation, statistical analyses, and optimization methods with traditional process design heuristics toward meeting these challenges. These challenges include investigation of the possibility of combining selected operations, scheduling arrivals to the process from upstream operations, quantity and configuration of machines appropriate to each operation, comparing effectiveness of various line-balancing alternatives, sizes and locations of in-process buffers, choice of material-handling and transport methods, and allocation of manufacturing personnel to various tasks such as material handling and machine repair. We then describe our approach to meeting these challenges via the integration of analytical methods into the traditional methods of manufacturing process design. This approach comprised the gathering and analysis of input data (both qualitative and quantitative), the construction, verification, and validation of a simulation model, the statistical analysis of model results, and the combination of these results with engineering cost analysis and optimization methods to obtain significant improvements to the original process design.
KEYWORDS
Transfer Line, Line Balancing, Process Simulation, Process Design
1 Introduction
During the past forty years, manufacturing systems have been one of the largest application areas of discrete process simulation, typically addressing issues such as type and quantity of equipment and personnel needed, evaluation of performance, and evaluation of operational procedures [1]. Furthermore, simulation analysis is increasingly allying itself with other traditional methods of manufacturing process design such as line balancing, layout analysis, and time-and-motion studies [2].
In this paper, we first present an overview description of the existing and proposed production system under study and its operational flow. Next, we specify the project goals and performance metrics of the system, and review the data collection and approximations required to support these modeling objectives. We then describe the construction, verification, and validation of the simulation models. In conclusion, we present the results obtained from the statistical analyses of the model output, the use of those results in actual process design, and indicate further work directed to continuous improvement. An analogous application of simulation to the NP-hard problem of balancing a manual flow line is documented in [3]. Use of simulation to gather data needed to balance an assembly line is described in [4]. Other examples of studies likewise illustrating synergistic alliance of simulation with other analytical and/or heuristic techniques examine scheduling of production in a hybrid flowshop [5], determination of constraints in a foundry [6], and determination of the minimum number of kanbans required to meet production requirements [7]. “Kanban,” the Japanese word for “card,” refers to a manual system of cards used to control a pull system and keep work-in-progress at each machine constant as a function of time [8].
2 Overview of Production System
The production system studied for improvement with the help of simulation modeling produces an automotive component. The production system utilizes the material process flow of the traditional transfer line frequently found in the automotive industry.
2.1 Transfer Line
Production flow systems, in the form of transfer lines, are used extensively in automotive and other high volume industries. Efficient operation of such lines is important to the financial success of firms competing in these industries.
Consider a manufacturing line where n operations (such as drilling of holes, smoothing of surfaces, spot welds, etc.) must be performed on each component processed. These n operations are to be performed by m machines, where m << n. In general, the n operations take widely varying amounts of time.
In a transfer line, the n operations are assigned to the m machines such that the work assigned to each machine takes about the same amount of time. For example, a particular machine may be assigned the task of drilling several different holes in succession. Achieving such a set of assignments of operations to machines is called “line balancing,” and success in line balancing is vital to high efficiency [9]. The balancing is important because of an essential characteristic of a transfer line: no movement of components from machine to machine may occur until all components are ready to move (i.e., all machines have completed all operations assigned to them). For example, if one machine goes down, all movement stops. This balancing may have to accommodate precedence relationships among operations. For example, if three operations are drill hole “A,” drill hole “B,” and drill hole “C,” those operations can presumably be done in any order (absence of precedence relationship). However, two operations “drill hole ‘A’” and “thread hole ‘A’” have a precedence relationship – the hole must be drilled before it is threaded. “Flexible transfer line” has long been desired [10]. Today the increased speed of machining operations and
application of modular design are now improving flexibility of transfer lines [11].
2.2 Existing Production Line
The existing production system is a “lights out” system; that is, it is fully automated with respect to machine operations and hence no operators are used in the production of the component. Operators are on staff to repair workstations when downtime occurs.
The existing production line consists of four pairs of workstations in parallel (OP10 and OP20), which perform drilling operations on the component. The components enter the production system in batches of two. Once the last drilling operation is complete at OP20, the components feed into the main line, singly, using first-in first-out (FIFO) logic. The component will experience a discrete stop at each of the six additional workstations. The workstation at the upstream end of the main line is a wash machine (OP30) followed by a leak tester (OP40), assembly table (OP50), drill machine (OP60), leak tester (OP70), and inspection table (OP80). Like the operations themselves, transfers of components from workstation to workstation are fully automated. Figure 1 illustrates the operational flow of the existing production system. Some examples of precedence relationships appear within this line. For example, the inspection operation (OP80) must follow every other operation, and hence must come last. Likewise, testing for leaks must be done both before and after drilling, creating pairwise precedence relationships, one between operation 40 and operation 60; and one between operation 60 and operation 80.
Figure 1 Diagram of Existing Production System
2.3 Proposed Production System
The objective of the proposed production system is to maintain “lights-out” production and increase the throughput. The proposed production system combines the drilling operations (OP10 and OP20) at the beginning of the transfer line. The components will enter the system singly to one of eight workstations (OP100), which will perform the drilling operations that currently require two separate operations in the existing production system. After the drilling operations are completed, the parts enter a proposed buffer area with FIFO logic, which has a defined capacity. This buffer represents a proposal to increase throughput of the component by “working-around” the shortfall of a transfer line. The main line remains the same as in the existing production system. Emerging from the buffer, the components feed into the main line, singly, experiencing a discrete stop at each of the six workstations. The workstation at the beginning of the main line is a wash machine (OP200) followed by a leak tester (OP300), assembly table (OP400), drill machine (OP500), leak tester (OP600), and inspection table (OP700). Automatic transfer of components between workstations will remain the same as in the existing production line. The use of operators, again, is only for repair of workstations experiencing downtime. Figure 2 shows a diagram of the proposed production system with the buffer area and new material flow.
Figure 2 Diagram of Proposed Production System
3 Project Goals and Performance Metrics
The goals of this project were the assessment of the system relative to performance metrics and identification of the most cost-effective ways to improve system performance. The two most fundamental metrics were throughput, measured in jobs per hour (JPH), and average work-in-process (WIP), the number of components in the production system. Both metrics were readily available from each simulation run. Process engineers were keenly interested in discovering revisions to the system capable of reducing the inevitably positive correlation between these two performance metrics; i.e., achieving significant increases in JPH with only minor increases in WIP.
4 Collection and Approximation of Data
4.1 Existing Production System
Pertinent data for the existing production system were readily available. The operation cycle times and transfer times between machines were obtained from equipment specifications and verified with direct traditional motion and time studies [12]. However, downtime data were not directly available. Therefore, workers with direct line and production experience were asked to specify shortest plausible, most typical, and longest plausible repair times and times between failures. This preliminary approach to modeling downtime works tolerably well in the absence of ample historical data [13].
4.2 Proposed Production System
The collection of data for the proposed production system was approached differently. The operation cycle times for the main line in the existing and proposed systems remained nominally the same, based on preliminary conversations with equipment vendors. However, partly because these cycle times predicted by vendors were tentative and volatile, and primarily because the process engineers were highly interested in performance metric responses to plausible changes in these cycle times, the model users were provided menus for exploring the effects of various cycle times easily. Such detailed exploration of system sensitivity to changes in specification (“sensitivity analysis”) is readily undertaken via design of experiments (DOE) [14].
5 Construction, Verification, and Validation of Models
Before the actual construction of the simulation models, all assumptions were explicitly listed, and the plant engineers and simulation analysts agreed upon them. Explicit acknowledgment and documentation of these assumptions is essential to simulation project success [15]. In this project, the following assumptions were:
Downtimes and repair times are well approximated by triangular distributions
Each workstation in the main line has a capacity of one component
Operators are always available for machine repair, without reference to shift patterns
Finished parts always leave the main line without hindrance or blockage
Raw material is infinitely available (no starvation at the upstream system-environment interface point)
There is no downtime involving workstation-to-workstation transfer; i.e., material-handling equipment
experiences no downtime.
Three models were developed, two base models and one alternative model. The models were developed using ProModel®, a simulation software tool combining high analytical power, easy access to animation capability, excellent support, and the ability to construct a run-time user interface [16]. These and other considerations guiding choice of simulation software tool are summarized in [17]. All models were tailored to the client to answer “what if” scenarios using macros to initialize and change system parameters. This interface allowed the client to interact with the model to analyze whether the model correlates to the real world system by comparing the performance metrics of the systems. Significantly, using this technique allowed faster verification and validation of the model, thereby increasing its credibility – the willingness of engineers and managers to trust model output as guidance in making decisions involving economic risk [18]. The macros allowed the client to change the buffer capacity, mean times between failures (MTBF), mean times to repair (MTTR), number of operators on call, the number of workstations in operation at the new operation 100, and whether a specified machine experiences downtime.
The first base model was a replication of the existing system without variation (i.e., downtime). Omission of all stochastic variability from this first model permitted direct closed-form analytical validation [19], thereby increasing the model’s credibility. The second base model added stochastic variation, consisting of unscheduled downtime, number of operators, and available buffer sizes. The third, alternative, model, representing the potential modifications to the productions system mentioned earlier, was likewise developed to include stochastic variability and to allow ease of experimentation.
Several techniques were used to verify these models (confirming their execution matches the analysts’ intentions) and validate them (confirm their output is believable and representative of the real system under study) [20]. These technique included structured walkthroughs of model logic, use of stepwise execution and traces, and extensive interviews among the model builders and process engineers most familiar with the real system [21]. These verifications and validation techniques are a necessary component of high-quality manufacturing simulation practice [22].
6 Analysis of Results
Since this is a steady-state system, a warm-up period, chosen to be ten hours, was necessary to eliminate initial bias [23]. Following this warm-up period, all replications were run for an equivalent of 100 hours of production. Typically, between five and ten replications were required to construct suitably narrow confidence intervals for the key system performance metrics. The tables below (Tables 1 and 2), based on ten replications each, present the simulation results from the existing system (including stochastic variation) and the proposed system respectively.
Table 1 Existing Production System JPH
Table 2 Proposed Production System JPH
As mentioned above, introduction of the buffer areas attempted to increase throughput of the component by “working-around” the shortfall of a transfer line. Use of simulation suggested that throughput from the line could be improved with the introduction of additional and/or larger buffers between certain workstations on the line. These inferences were corroborated by theoretical work in which hypothetical transfer lines were mathematically modeled as continuous flow processes [24]. Since increases in buffer capacity characteristically entail an increase in work-inprocess, the model outputs were examined in the context of economic tradeoffs between JPH and WIP. Derivatively, increases in buffer size typically entail, from the facility layout point of view, increasing the overall floor space required to accommodate the process. Therefore, the simulation results were also examined in the context of how best to increase JPH with only small WIP increases. Much of this exploration involved investigating which workstations would provide the greatest such improvement in return for investments made in increasing MTBF and/or decreasing MTTR. In the context of this study, the capital investment required to balance the line (versus allowing OP 60 to require more time) proved itself amply justified. Furthermore, the average 2¼% improvement in throughput [JPH] attainable by implementation of four buffers also produced a favorable rate of return relative to the consequential moderate increase in floor space and the slight increase in WIP involved. Further exploration involved study of centralized versus decentralized storage of WIP; this decision is well recognized as a frequent key determinant of production efficiency [25].
7 Conclusions And Indications For Further Work
Plans under development call for the migration of this production system to a cellular manufacturing configuration. The application of cellular manufacturing, a “divide and conquer” strategy of grouping machines, processes, and people into workcells with largely homogeneous responsibilities, holds much promise for significant improvements in efficiency [26]. Challenges of modeling and analyzing such cellular manufacturing systems are severe, and may call for the development of approximate analytical, “closed-form” numeric models in conjunction with discrete process simulation stochastic models [27].
More broadly, as a result of productivity improvements attributable to this project, simulation has achieved acceptance among a succession of process engineers as an analytical tool to be routinely used in conjunction with layout analysis, scheduling, time-and-motion studies, and traditional heuristics guiding process design and implementation. It is via “trial by application” that simulation must gradually, yet convincingly, earn acceptance as a manufacturing productivity improvement tool [28].
Acknowledgments
The authors gratefully acknowledge the contributions of John Chancey, Ford Motor Company, Dr. P. E. Coffman, Jr., Ford Motor Company, and Professor Onur M. Ülgen, University of Michigan – Dearborn, toward the content, organization, and clarity of this paper.
Appendix: Trademarks
ProModel is a registered trademark of PROMODEL Corporation.
REFERENCES
[1] Law, Averill M., and Michael G. McComas. 1998. “Simulation of Manufacturing Systems.” In Proceedings of
the 1998 Winter Simulation Conference, eds. D. J. Medeiros, Edward F. Watson, John S. Carson, and Mani S.
Manivannan, 49-52.
[2] Markland, Robert E., Shawnee K. Vickery, and Robert A. Davis. 1998. Operations Management : Concepts in
Manufacturing and Services, 2nd edition. Cincinnati, Ohio: South-Western College Publishing.
[3] Praça, Isabel C., and Rua São Tomé. 1997. “Simulation of Manual Flow Lines.” In Proceedings of the 9th
European Simulation Symposium, eds. Winfried Hahn and Axel Lehmann, 337-341.
[4] Grabau, Mark R., Ruth A. Maurer, and Dennis P. Ott. 1997. “Using a Simulation to Generate the Data to
Balance an Assembly Line.” In Proceedings of the 1997 Winter Simulation Conference, eds. Sigrún Andradóttir,
Kevin J. Healy, David H. Withers, and Barry L. Nelson, 733-738.
[5] Belkhiter, Moussa, Michel Gourgand, and Mamadou Kaba Traore. 1997. “Dynamic Scheduling and Planning of
the Production in a Hybrid Flowshop: Simulation and Optimisation of a Multicriterion Objective.” In
Proceedings of the 9th European Simulation Symposium, eds. Winfried Hahn and Axel Lehmann, 358-362.
[6] Prisk, Walter, Brian Bahns, Craig Byers, and Michael Opar. 1997. “Foundry Operation Simulation, Using
Simplification Mapping.” In Proceedings of the 2nd Annual International Conference on Industrial Engineering
Applications and Practice, Volume Two, eds. Jacob Jen-Gwo Chen and Anil Mital, 961-964.
[7] Hall, John D., Royce O. Bowden, Bruce Nicholas, and Bill Hadley. 1996. “Determining the Number of
Kanbans Using Simulation and Heuristic Search.” In Proceedings of the Fifth Industrial Engineering Research
Conference, eds. Ronald G. Askin, Bopaya Bidanda, and Sanjay Jagdale, 299-304.
[8] Morton, Thomas E., and David W. Pentico. 1993. Heuristic Scheduling Systems : With Applications to
Production Systems and Project Management. New York, New York: John Wiley & Sons, Incorporated.
[9] Martinich, Joseph S. 1997. Production and Operations Management : An Applied Modern Approach. New
York, New York: John Wiley & Sons, Incorporated.
[10] Winter, Drew. 1999. “Tooling Up for Change.” Ward’s Auto World 35(4):47.
[11] Owen, Jean V. 1999. “Transfer Lines Get Flexible.” Manufacturing Engineering 122(1):42-50.
[12] Mundel, Marvin E., and David L. Danner. 1994. Motion and Time Study : Improving Productivity.
Englewood Cliffs, New Jersey: Prentice-Hall, Incorporated.
[13] Williams, Edward J. 1994. “Downtime Data – Its Collection, Analysis, and Importance.” In Proceedings of
the 1994 Winter Simulation Conference, eds. Jeffrey D. Tew, Mani S. Manivannan, Deborah A. Sadowski, and
Andrew F. Seila, 1040-1043.
[14] Kleijnen, Jack P. C. 1998. “Experimental Design for Sensitivity Analysis, Optimization, and Validation of
Simulation Models.” In Handbook of Simulation, ed. Jerry Banks, New York, New York: John Wiley & Sons,
Incorporated.
[15] Musselman, Kenneth J. 1994. “Guidelines for Simulation Project Success.” In Proceedings of the 1994 Winter
Simulation Conference, eds. Jeffrey D. Tew, Mani S. Manivannan, Deborah A. Sadowski, and Andrew F. Seila,
88-95.
[16] Heflin, Deborah L., and Charles R. Harrell. 1998. “Simulation Modeling and Optimization Using ProModel.”
In Proceedings of the 1998 Winter Simulation Conference, eds. D. J. Medeiros, Edward F. Watson, John S.
Carson, and Mani S. Manivannan, 191-197.
[17] Rachamadugu, Ram, and Dhamodararaj Kannan. 1999. “User Perspectives on Discrete Event Simulation
Software.” In Proceedings of the Industrial & Business Simulation Symposium, ed. Maurice Ades, 78-83.
[18] Law, Averill M., and W. David Kelton. 1991. Simulation Modeling and Analysis, 2nd edition. New York, New
York: McGraw-Hill, Incorporated.
[19] Schriber, Thomas J. 1974. Simulation Using GPSS. New York, New York: John Wiley & Sons.
[20] Barth, Tom, and Jane Algee. 1996. “Proving and Improving Your Process with Simulation.” In Proceedings
of the 1996 International Industrial Engineering Conference, 522-525.
[21] Harrell, Charles, and Kerim Tumay. 1995. Simulation Made Easy : a Manager’s Guide. Norcross, Georgia:
Engineering and Management Press.
[22] Norman, Van B., James H. Emery, Christopher C. Funke, Frank Gudan, Kenneth Main, and David Rucker.
1992. “Simulation Practices in Manufacturing.” In Proceedings of the 1992 Winter Simulation Conference, eds.
James J. Swain, David Goldsman, Robert C. Crain, and James R. Wilson, 1004-1010.
[23] Banks, Jerry, John S. Carson, II, and Barry L. Nelson. 1996. Discrete-Event System Simulation, 2nd edition.
Upper Saddle River, New Jersey: Prentice-Hall, Incorporated.
[24] Fu, Michael, and Xiaolan Xie. 1998. “Gradient Estimation of Two-State Continuous Transfer Lines Subject to
Operation-Dependent Failures.” TR 98-57, Institute for Systems Research,
http://www.isr.umd.edu/TechReports/ISR/1998/TR_98-57/TR_98-57.pdf.
[25] Tompkins, James A., John A. White, Yavuz A. Bozer, Edward H. Frazelle, J. M. A. Tanchoco, and Jaime
Trevino. 1996. Facilities Planning, 2nd edition. New York, New York: John Wiley & Sons, Incorporated.
[26] Bazargan-Lari, Massoud, and Hartmut Kaebernick. 1996. “Intra-Cell and Inter-Cell Layout Designs for
Cellular Manufacturing.” International Journal of Industrial Engineering — Applications and Practice 3(3):139-
150.
[27] Gupta, Surendra M., and Ayse Kavusturucu. 1998. “Modeling of Finite Buffer Cellular Manufacturing
Systems with Unreliable Machines.” International Journal of Industrial Engineering — Applications and
Practice 5(4):265-277.
[28] Williams, Edward J. 1997. “How Simulation Gains Acceptance as a Manufacturing Productivity Improvement
Tool.” In Proceedings of the 11th European Simulation Multiconference, eds. Ali Rıza Kaylan and Axel
Lehmann, P-3—P-7.
Author Biographies
Scott J. Suchyta is currently pursuing a dual bachelor’s degree in Industrial and Manufacturing Engineering at the University of Michigan – Dearborn. From 1996 to 1999, he held an internship at Advanced Manufacturing Technology Development of Ford Motor Company, where he performed statistical analyses, scheduling, simulation, and project management that were integrated into the classroom environment. He is currently a member of Alpha Pi Mu (Industrial Engineering Honor Society), the Institute of Industrial Engineers [IIE], and the Society of Manufacturing Engineers [SME]. His knowledge of software technology includes ROBCAD™, SDRC I-DEAS™, ProModel™, Minitab™, and Boothroyd and Dewhurst, Incorporated DFMA™.
Edward J. Williams holds bachelor’s and master’s degrees in mathematics (Michigan State University, 1967; University of Wisconsin, 1968). From 1969 to 1971, he did statistical programming and analysis of biomedical data at Walter Reed Army Hospital, Washington, D.C. He joined Ford in 1972, where he works as a computer software analyst supporting statistical and simulation software. Since 1980, he has taught evening classes at the University of Michigan, including undergraduate and graduate statistics classes and undergraduate and graduate simulation classes using GPSS/H, SLAM II, or SIMAN. He is a member of the Association for Computing Machinery [ACM] and its Special Interest Group in Simulation [SIGSIM], the Institute of Electrical and Electronics Engineers [IEEE], the Institute of Industrial Engineers [IIE], the Society for Computer Simulation [SCS], the Society of Manufacturing Engineers [SME], and the American Statistical Association [ASA]. He serves on the editorial board of the International Journal of Industrial Engineering – Applications and Practice
Case Study of Integrated Industrial Engineering Methods with Simulation
Phases of Simulation
Define the problem
Design the study
Design the conceptual model
Formulate inputs, assumptions, and process definition
Build, verify, and validate the simulation model
Experiment with the model and look for opportunities for design of experiments
Document and present the results
Define the model life cycle
Simulation Methodology
The eight phases of simulation provide a recipe for analysis success
Each phase has from 4 to 13 activities for completion
Each phase has a documentation deliverable associated with it
Phase 1: Define the Problem
Focus:
What questions will we ask the model?
What do we want to achieve?
What is the scope/boundary?
How much work/time will it take?
Deliverable:
Formal proposal document
Phase 2: Design the Study
Focus:
Estimate model life cycle
Describe how performance will be measured
Determine project timing and priority
Deliverable:
Project functional specification document
Phase 3: Conceptual Model
Focus:
Describe the “real” system in abstract, modeling terms
Determine the level of detail
Decide on statistical output interpretation
Deliverable:
General model specifications document
Phase 4: Formulate Inputs, Assumptions and Process
Focus:
Process logic definition
Analysis of input data
List modeling assumptions
Deliverable:
Detailed model specifications document
Phase 5: Build, Verify and Validate the Model
Focus:
Construction and coding
Verification and validation
Calibration
Deliverable:
Validated base model
Phase 6: Experiment with the Model
Focus:
Determination of cause and effect relationships
Identification of major influences
Analysis of results
Deliverable:
Simulation Results documentation
Phase 7: Documentation and Presentation
Focus:
Communication of results
Communication of methods
Maintenance and user documentation
Deliverable:
Final report documentation
Phase 8: Model Life Cycle
Focus:
Field validation tests
User friendly I/O interfaces
Model training and responsibility
Deliverable:
Formal proposal document
Input Data Analysis
Why is it important?
G-I-G-O (Garbage In …)
Need to accurately capture individual component behavior
Need to identify “patterns” that describe the variability of system components
Simulation Output Analysis
Run Length
Replications
Output Analysis
Bottleneck Analysis
Warm-up Plot, JPH/Time
Bottleneck Analysis
Compare the busy, idle, down and blocked time of each work station
Compare the average number of parts in each buffer and on each conveyor segment
Perform sensitivity analysis to identify which parameter has to most impact
General characteristics of a bottleneck work station
Lowest blocked time
Lowest idle time
Highest busy time
Upstream buffers are mostly full
Downstream buffers are mostly empty
Upstream workstation are blocked
Downstream workstations are idle
Simulation Guidelines
Technical guidelines
Managerial guidelines
Elements of failure
Elements of success
Technical Guidelines
Clearly define objectives
Diagram process flow
Understand the model life cycle
New vs. existing systems
Start with a simple model, add complexity later as needed
Get users involved in model building
Be familiar with the data collection process – question the data
Verify the model by making deterministic and extreme
condition runs
Validate the model against actual data
Be conservative in determining the experimental conditions
Use ranges (based on statistical calculations) rather than point estimates
Use time based plots for the major performance metrics
Start documentation from day one of the study
Managerial Guidelines
The project team should involve all key decision-makers on the problem
Identify one main user for the study and get his/her time commitment for the study
Make sure the main user (engineer) is involved with the study in all phases of the simulation project
Make it clear to the project team what type of results can and cannot be expected from the study
Report results as soon as possible and as often as possible
Work with many milestones throughout the project
Make sure all parties involved with the study hear about the results
Get input and resolve conflicts before going to the next step of the study
Control and document changes to the project
Focus more on the objective than on the model
There is no end to more detail and experimentation
Stop at the detail level necessary to produce accurate estimation of performance measures
Elements of Failure
Modeling for animation only
Modeling for the model’s sake
No predefined performance metrics
No documentation of communication of underlying assumptions and logic
Improper input data statistical analysis (or none)
Improper statistical methods (or none) for comparison of alternatives
No pre-definition of scope and objective
Improper level of detail (usually too much)
No pre-definition of system boundaries
Elements of Success
Ask the question:
What do I want to know from this simulation and how will I measure it?”
Draw firm system boundaries
Determine the correct level of detail
Decide what scenarios you want to evaluate
Project Management
Use a proven, structured methodology
Stick with it
Use a PM tool for planning and tracking
Keep notes on what you did right and what you did wrong
Document everything
Case Study: Material Flow and Indirect Labor Study
Agenda
Overview
IE Studies
Static and Dynamic Simulation
Results and Conclusions
Overview
A major study was performed at a manufacturing plant to identify opportunities for efficiency improvements:
The study generated recommendations for indirect labor and material flow improvements for current and future state operations.
The recommendations provided input to management about resource improvement proposals for local Union contract negotiations.
Various indirect labor assignments were evaluated including material handling equipment, i.e. forklift drivers, tugger drivers, crane operators, die setters, and stock chasers.
Various data collection and analysis techniques were used in the project:
Traditional IE studies for the development of time standards.
Material flow analysis using static simulation.
Dynamic resource simulation under varying production schedules.
Resource evaluation using forklift and tugger monitoring system.
Bar coding techniques for improved operational efficiencies.
The planning and operation simulation tools developed by PMC for this study provide the following benefits:
Allows change impact evaluation for various indirect resources for both the short-term and long-term planning horizons.
Tools are usable by trained plant personnel for what-if studies related to both current-state schedule fluctuations and future-state program changes.
Material flow model interfaces with plant AutoCAD layout and can be effectively updated as changes occur to the layout.
Project Savings
Summary
(21) Worker Assignments could be re-allocated on an immediate basis.
(14) Worker Assignments could be re-allocated with implementation of infrastructure improvement recommendations and analysis of ‘residual functions’.
(24) Worker Assignments could be re-allocated with Union consent, if classification changes are implemented.
These re-allocations represent a potential savings of $4.15 Million, in addition to the associated equipment and maintenance cost savings.
IE Studies
Extent & Areas Covered
Validated and updated plant’s existing databases pertaining to Material Handling
Developed time-elements and established time-standards where applicable.
Time studies covered (7) different Indirect Labor classifications throughout the plant.
(95) time studies executed over all 3 shifts.
Developed & updated standard work instructions based upon equipment used and required work practices.
Static and Dynamic Simulation
Simulation Overview
Diverse sources for input data:
Part numbers (Bill of Material, Pressroom Line-Up)
Container Information (Online Systems, Plant personnel)
Shift Schedules and Available Minutes Per Shift (Plant personnel)
Static Simulation Overview
Static Model uses Flow Path Calculator in conjunction with AutoCad
Provides capability to incorporate all material flow data into single database and calculates material handling utilizations.
Generates graphical output for flow analysis useful for identifying wasteful long-distance moves.
Creates congestion plots to highlight heavy traffic areas in the plant.
Output useful for identifying and evaluating opportunities to combine driver assignments and reallocate drivers.
Provides a tool for performing what-if scenarios to evaluate both short-term and long-term opportunities.
Static Simulation Flow – Subassembly Hilos
Straight FlowCongestion Diagram
Static Simulation What-If Scenario Example
Simulation
Dynamic Simulation Overview
Dynamic Model uses discrete-event simulation software with Excel Interface
Useful for evaluating the press room material handling resources including forks and tuggers where utilization fluctuates widely depending upon the press schedule.
Generates time-based charts that quantify the utilization of resources over time thus highlighting opportunities for material handling improvement in a dynamic environment.
Provides tool for evaluating and planning manpower required for current and future changes to the pressroom lineup schedule.
Dynamic Model Output Example
Sample Model Output for HiLo Group servicing two lines
Dynamic Model What-if Example
What-if: Combine coverage for two Press Lines
Before
After
Results and Conclusions
Opportunity to reallocate 59 material handling people presents potential savings of $4.15 Million.
Integrated approach utilized various analytical and IT tools in a comprehensive manner to evaluate indirect labor resources, including personnel and equipment
Tools can be utilized for ongoing efficient analysis of indirect labor resources required by changing production conditions in the plant from both short-term pressroom schedule changes to long-term program changes.