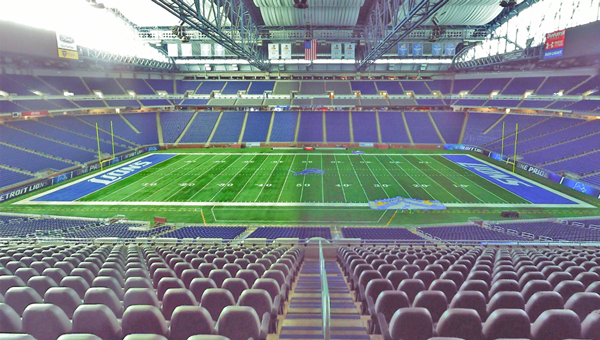
Sports and Entertainment digital twin technology (reality capture) are changing the way venues are planned, renovated, and maintained. In this article we will explore how our laser scan to point cloud and 3D rendering capabilities provided extreme value to the commissioned architecture firm that redesigned the Ford Field Concourse. We’ll also show you how to expand that scope to better plan and execute large scale project with dynamic computer simulation, as opposed to traditional static computer simulation. These methods not only apply to sports and entertainment digital twins, but large complexes and cities as well.
Detroit – A Little History
Located in Downtown Detroit, Ford Field sits at the heart of a bustling city that has found a comeback over the last 20 years. With the closure of the Pontiac Silverdome in 2002, the Detroit Metro area found a new sports venue with Ford Field breaking ground in 1999 as an early piece to the revitalization puzzle. Various initiatives have since restored historical sites across the city, driven by the influx of corporate interests which led to the development of Little Caesars Arena and a surge in career opportunities bringing Millennials to live and work in Midtown.
With a maximum capacity of 80,000 attendees in the stadium, Ford Field played host to the 2006 Super Bowl XL, and will support the upcoming NFL Draft, revisiting Ford Field in Spring of 2023. Ford Field’s popularity and technology have proven to be a major asset to the city. After 10 years of service and high traffic, the main concourse, food vendor stalls, and premium experience suites of Ford Field were commissioned to be redesigned in 2017.
Ford Field Concourse
In preparation for the complete redesign and fit-out of the concourse, the lead architecture design firm required a solid CAD foundation to work from, including precise measurements and strong visualizations of the space as it stood. With a digital twin of the existing space, the design architects could execute design validation, build construction documents, and plan interior fit-out of all the suites and the concourse. At the onset of the project, there was no working data to initiate the project.
Our team was contracted to assist with developing a digital twin of the concourse, including data capture with laser scanning, and training the existing architectural firm team on how to best utilize and translate the data sets into a 3D BIM model.
Often when a laser scan project is launched, the team utilizing the digital twin technology may not always have the capability or time to develop the 3D model on their own. Luckily the team with the architectural firm was well-versed in 3D modeling, only requiring PMC to manage the massive amount of data sets and teach them how to translate the point cloud into the modeling software.
Data Capture
1500 scan plan capture locations 5 night shifts on-site 40 hours to train the design team
At the onset of the project, we established a scope of work that entailed our process:
Design team scope discovery, venue walkthroughs, and planning with venue management
The site scan plan, which ensured efficient scanner placement at strategic vantage points and data completeness
Working with the venue for logistics and time considerations as an active site to the public
Coordination with the Project Managers at the architectural firm for design validation and to deliver data in manageable portions
Training their design teams to convert and utilize the data in Revit 3D Modeling software
The Ford Field Concourse project had a large scan registration consisting ofover 1500 scans. It was therefore critical that we provided manageable amounts of data sets for them to utilize during their process. We were also responsible for ensuring the design firm received the appropriate data during critical phases of their design schedules.
After this was completed, new renderings of fixtures, displays, furniture, lighting, and other furnishings could be added for the new interiors by the design architects’ own team in Revit.
Imagine the Possibilities
With fully rendered3D models of sports and entertainment venues, it is possible to show prospective tenants what the premium suite redesign will look like before it is completed. Additionally, virtual reality and augmented reality experiences (VR/AR Mixed) can be created to give the consumer a very realistic representation of the venue’s future, enabling early sales and faster return on investment.
Virtual Reality and Augmented Reality Experiences
When a scan is completed of the entire stadium, not just of the concourse, the customer experience is amplified to the extent that they can see an exact representation of what their view is going to be before they purchase a ticket or season pass.
If the venue utilizes the data setsfurther, they can add more value by delivering concessions right to their attendee’sseat with mobile apps. Using artificial intelligence we can protect customers’ identities using facial recognition software to blur their appearance.
From a maintenance perspective, the digital twin can capture the structure and components of the venue to track replacement parts, repairs, prepare maintenance schedules, and plan and implement smart technology that remote controls lighting and hydraulics. Developing and maintaining a representation of the IoT in a sports and entertainment venue creates more efficiency and enables the longevity of the venue in our ever-changing world of technology.
Digital twins can also enable pedestrian dynamic planning and optimization. Imagine having a real representation of how 80,000 people move through a large venue to reach concessions, ticket sales, vomitoriums, restrooms, and luxury suites, and even evacuation plans as well. This enables design and engineering teams to plan more effectively and venue management to ensure training is effective for the safety of their teams and the public at-large.
Reality capture is a term used to convey a sense of completeness in terms of data that Digital Twins provide to Architectural Engineering and Construction firms, Venue Organizers and Owners, Site Planners, and even Municipalities. Having the ability to gather reality in a point cloud and transferring the data into a 3D model allows for designers and engineers to accurately depict potential futures without the time and cost of gathering measurements by hand or relying on blueprints.
Specifically digital twins can help avoid costly mistakes, reduce material costs, expedite project timelines, and optimize the spaces we live and work in.
Optimizing pedestrian flow and guest experience at NASA’s Kennedy Space Center.
Planning zoo enclosure formats and location, establishing pedestrian flows through the park.
Scanning for the restoration of historic features. High detail meshing of laser scans to visualize current and future states.
Scanning and model development to facilitate new sports betting:
The scope and scale of reality capture is only limited to our own perception of what is possible. Not limited to sports and entertainment venues, Smart Cities and Smart Complexes are achieved through reality capture and dynamic simulation processes as well.
Determine the Need for Reality Capture
When planning to integrate reality capture and digital twins into your project, it will likely become necessary to speak with an expert in these areas to determine what your needs are to achieve your objectives, unless you have members of your own staff that are capable of point cloud capture, 3D rendering knowledge, and dynamic simulation.
Even so, experts in these fields may not understand the full scope of what can be achieved through a complete digital twin of your scenario. This is the reason so many companies, municipalities, and even other engineering and architecture firms rely on specialists like ours.
Reach out to us via the form below to schedule a time to speak with our reality capture and digital twin technology experts to help identify what the possibilities are for your initiatives.
Reach out to us with the form below to get a better sense of what a dynamic digital twin technology can do for you:
The client is a leading global supplier of automotive dampers and performance shock absorbers in commercial and defense segments. PMC was able to offer its expertise in Ergonomic Analysis, MODAPTS and Dynamic Simulation modeling to identify the challenges faced by the customer to improve the current throughput in their efforts for capacity expansion. Our utilization of discrete event simulation techniques and Ergonomic analysis techniques allowed the company to identify utilization of all the stations and operators working in the production line, identify the potential ergonomically perilous activities carried out by the operator and provide solutions to the high-risk ergo concerns. The combination of Simulation Analysis along with Non-Value-added (MODAPTS) analysis and Ergonomic analysis has resulted in improvement in the line capacity and throughput.
SYSTEM DESCRIPTION
The current line has 11 stations running 2 shifts per day. Each shift being 8 hours there are 11 operators allocated to the stations. There are 2 stations which are replenished by the line leaders in addition to the 11 operators. Out of the 11 stations, 2 station are outside the line in the current state, which will eventually be shifted to the line in the future state. There are 22 FGI parts for 2 different customers (Customer A and Customer B) making a share of 66.7% and 33.3% respectively. A third of the FGI parts produced for Customer A go through the offline machines currently. Essentially there are 2 different process flows with respect to the type of FGI being produced.
OPPORTUNITY
The current process flows and procedures at the plant have been proving to be inefficient to improve productivity, and meet customer demands due to ramping up of production and inclusion of new products on the line. With the unreliable equipment on the line the company had a challenge to improve their throughput with wide product variety and high changeover times. It was necessary for the client to focus on the current operational improvements to reduce the overall cycle time of the products.
APPROACH
a) Data Collection and Validation (PFEP): Data collection in simulation modelling is a vital process that highlights the required data sets and their desired properties such as accuracy, sample period and format to allow the simulation model to achieve the project objectives. A PFEP (Plan for Every Part) was developed with the data collected from various sources and validated on the line.
b) Ergo Analysis (JACK): All the operator movements associated with operations, handling etc., during production for each station have been captured and studied. The 3D models of the stations were imported to JACK to study the movements of the operators at and between the stations and the postures were simulated. The Ergo analysis provided qualitative and quantitative rating to the movements of the operator. One of the rating systems that provide the magnitude of risk associated with a task is RULA (Rapid Upper Limb Assessment). From the analysis, the medium to high risk items were identified and suggestions/improvements were made on these operator movements. The suggestions were re-simulated in Jack and results were provided. This unique technique of PMC has ensured that the customer identified the tasks that will need immediate changes and eventually it would save on cycle time due to minimization or elimination of high-risk tasks.
c) MODAPTS: PMC’s expertise in MODAPTS is utilized in this case to identify the Non-value added and waste movements of the operators in the process for each station. All the operator movements were video recorded and analyzed utilizing a custom built MODAPTS sheet created by PMC. The MODAPTS sheet gives an account of all the Value Added, Non-Value Added and Waste activities associated with the process. Based on the operations suggestions were made on tasks, equipment utilized in the operations by the operator and standard operating procedures to minimize the Non-Value Added and Waste times associated with the cycle. At this point MODAPTS and JACK analysis improvements go hand in hand, since any changes made to ergonomics would reflect in MODAPTS due to change in the operation.
d) Simulation Model (PlantSim): The layout, the PFEP and the Production Schedule are fed to PlantSim, to get the base simulation model. The current process flows of material and the operators are incorporated in the model. The current capacity and throughput are obtained after running the simulation for 40 days with provided schedule. The changes made through Ergo analysis and NVA study are incorporated in the simulation study to get the future state simulation model and an analysis of the simulation results were made.
SOLUTION
The improvements made through the MODAPTS NVA analysis and the JACK ergonomic analysis resulted in efficient utilization of the operators at the stations. By simulating the changes made and running scenarios the following throughput improvements have been achieved.
1. Base model + MODAPTS NVA Analysis + Jack Ergo Analysis – 4.33% improvement in throughput
2. Scenario 1 + Addition of resource – 25.56% improvement in overall throughput
3. Scenario 2 + Change in SOPs – 41.77% improvement in overall throughput
BENEFIT
The unique approach to problem solving through simulation not only achieves the output the client wishes for but also identifies the hazardous and perilous processes along the way and aims to keep the work environment streamlined and safer while being efficient at the same time.
The client, a major automotive company, desired a new vehicle distribution system for its North American dealership network. The goal was to create a system that would be responsive to customer choices while reducing distribution costs. After comprehensively evaluating the supply chain, with an emphasis on customer satisfaction metrics, PMC developed and recommended a Distribution Center (DC) plan which optimally balanced customer needs and transportation costs. This plan demonstrated the possibility of reducing transportation costs by 25% while simultaneously improving customer service.
CLIENT CHALLENGES
• Inefficient vehicle distribution system
• High inventory at point of sales location
• Low customer responsiveness
• High transportation costs
• Long vehicle delivery times
• Inadequate service levels
SYSTEM DESCRIPTION
Vehicles manufactured abroad were shipped to multiple ports within the United States to satisfy North American demand. Dealerships received
inventory directly from the ports nearest to their respective metro area. Most transportation from portside distribution centers to dealerships was performed via road transportation (i.e. trucks).
OPPORTUNITY
The primary objective of the project was to improve customer satisfaction with a cost-effective distribution plan. Features of the former plan targeted for improvement included:
• High Transportation costs between ports and metro markets
• Long vehicle delivery times
• Waning customer satisfaction metrics relating to vehicle choice and availability
The client was considering the introduction of more distribution centers, closer to dealerships, as a potential strategy for improvement. PMC was tasked with both developing tools to generate and evaluate various distribution center placement alternatives, and proposing an improved distribution plan. Both the quantity and location of distribution centers were to be analyzed.
APPROACH
PMC’s first step was to thoroughly document the existing distribution network. To do this, a multi-step plan was initiated: First, process maps describing the customer and vehicle flow were created. Then, key contributors to customer service level and transportation costs were identified, using created dynamic and stochastic input variables. Such variables included dealer inventory control policies, truck load factors, customer demand and demand seasonality, as well as transportation delays. PMC consultants developed both a Mixed Integer Program (MIP) optimization and discrete event simulation model to represent the details of the distribution network. Results of the MIP, obtained with AMPL Plus, combined with ProModel what-if analysis techniques were used to determine the optimal number of DCs to include and the ideal locations to place them.
SOLUTION
PMC’s MIP was developed to generate distribution center alternatives that minimized transportation-related costs per year. The alternatives were then evaluated using the simulation model, which explicitly considered the probability and dynamic elements in the system, and hence, estimated the overall effect of the given options more realistically. The client was updated on the distribution network options available to them, the expected benefits of each, and the new design recommended by PMC.
BENEFIT
The solution outcomes demonstrated that a decentralized DC concept would achieve the designated performance criteria. Significant cost reduction opportunities relating to DC inventories and transportation modes were revealed. It was shown that, under certain circumstances, the recommended distribution network could yield over $20 million savings per year in transportation-related costs. In addition to cost savings, the distribution plan improves customer service levels by increasing the likelihood of first-choice vehicles being available and reducing the instances of lost customers.
A top tier supplier of agricultural and construction equipment launched several new products without developing corresponding labor standards to support the production process. This presented two major challenges to the management staff. The first issue related to the incentive program in place for production personnel. Without appropriate labor standards there was no way to tie incentives to operator performance. As a result operators were receiving maximum incentives regardless of performance. This resulted in higher labor costs and effectively eliminated the motivational aspect of the incentive program since there was no way to gauge operator performance. The second major issue was that the absence of labor standards resulted in highly unpredictable production levels. As a result, production forecasts were frequently inaccurate, leading to late orders and excessive order backlogs. In addition to the above the manufacturer was planning to install new production lines to expand capacity and needed to develop a future state plant layout that included a consolidation of similar operations, improved traffic flow, and adequate storage space.
SYSTEM DESCRIPTION
The manufacturing process was divided into stamping, welding, and assembly operations. Labor standards were absent in all three operational areas and work station design was not optimized in many cases.
OPPORTUNITY
A tour of the manufacturing facility revealed much opportunity for improvement using basic techniques of lean manufacturing. In addition to the lack of work standards there were numerous instances of parts and tools being stored on the floor, double-handling of material, and excessive line side stock. These conditions resulted in excessive operator walk time, poor ergonomic conditions, and potential safety hazards. Ultimately, these conditions lead to lower than expected throughput, highly variable production levels, low morale, and an ineffective incentive system.
APPROACH
Labor standards were developed using a systematic approach consisting of four steps. The first step was the creation of a video recording of the process. This video could then be referenced as needed. The next step was to reference blue prints for welding specifications. The third step was to input all of the work elements into EASEworks® software. This software had been customized to contain predetermined times for most of the common elements performed and was used to record and calculate the labor standard. Finally, the fourth step was to create standard work instructions and process sheets for each job. After work standards were created work stations were reviewed for improvement opportunities and a proposed future state layout was created.
SOLUTION
Labor standards were developed in conjunction with the application of lean initiatives and process improvement efforts. While engineers were developing labor standards, waste, which was prevalent in the operations, began to surface. Process improvement techniques were then implemented with the intent of eliminating this waste and were directed in such a way as to produce the highest impact for the smallest investment. A proposed future state layout was also developed.
BENEFIT
Labor standards were developed for all operations and standard work instructions and process sheets were created. Work station design was also optimized to reduce walk time and improve ergonomic conditions. In order to eliminate excessive stock from work stations, improve part presentation to the operator, and reduce non-value added walk time material carts were designed and implemented. These carts included small bins to store hardware, shelves for small to medium sized parts (especially heavy parts), tool holders, and swivel castors to enhance mobility and flexibility. Deployment of these carts facilitated a reduction in both walk times and the floor space required for material storage and a simplification of the inventory counting process. In addition to the material carts, tool rails were hung to better position tools for the operators, lighting was improved, additional air and electrical feeds were installed, and flow racks were put in place for large part storage. These improvements led directly to improved quality, increased throughput, decreased production variation, and a reduction in required floor space. A future state layout was also developed incorporating all of the improvements. The resulting layout allowed for consolidation of all assembly/trim operations to one area of the facility, provided aisles to facilitate improved traffic flow and afforded additional space for warehouse and finished goods storage.
PMC’s established project management methodology was used to design, plan and implement material handling systems for a new engine assembly line at a large automotive engine assembly plant. It was clear from the outset that this was no ordinary move and would require extensive and complex planning in order to achieve the physical move within the required time frame. PMC’s experience as a material handling systems integrator helped the client achieve their goals through execution of proven solution processes.
SYSTEM DESCRIPTION
The project consisted of designing and relocating the existing parts warehouse, dock analysis, design and implementation of material delivery routes from warehouse to point of assembly, and material presentation at the station. The project also consists of sourcing equipment required at the warehouse, for material delivery, and at the station for better material presentation.
OPPORTUNITY
The primary challenge of this project was to achieve all of the project goals and objectives while adhering to the defined constraints. The primary constraints were scope, time, quality and budget. The secondary, and more ambitious, challenge was to optimize the allocation of necessary inputs and integrate them to meet pre-defined objectives.
APPROACH
PMC utilized project management techniques to effectively manage the project including: Initiating Processes, Planning Processes, Executing Processes, Monitoring and Controlling Processes, and Closing Processes. A series of standard templates and reports were created and used to execute and monitor the performance of the tasks throughout the various stages of the project. Some of the tasks/ steps involved in managing the project effectively were:
• Documenting and providing minutes of project status meetings
• Providing and maintaining the Project Plan including coordination and interface with other major
contractors (material handling equipment manufacturers, parts kit box suppliers, etc.)
• Identifying, tracking, managing, and resolving project issues
• Coordinating and interfacing with suppliers and sub-contractors
• Tracking equipment and system design changes
• Working closely with safety, ergonomic, logistics, team leaders, and various other stakeholders
during the design phase and during various stages of the project
BENEFIT
The warehouse relocation was successfully completed without interrupting the existing assembly line operation. The overall project was completed in time and within the budget. Effective project management contributed to customer quality, material integrity, asset management and overall compliance. The client was very satisfied in the way the entire project was managed and executed.
The client is a multinational conglomerate that focuses on industrial engineering and steel production. PMC offered a discrete-event simulation model to evaluate the design of a new production line and validate the throughput capacity envisioned by the client. Our utilization of discrete-event simulation techniques allowed the client to test different layout and process configurations in their design phase of their project.
SYSTEM DESCRIPTION
The facility has four operations – two assembling operations, one press area and one assembling/testing process split into various work stations.
One operator replenishes raw components for the first two operations and there is one robotic arm in each of the operations to transfer parts between the work stations.
The press area contains one press that receives assembled parts from previous operations and compress them so one of the three operators, on the last two operations, can pick and transfer the compressed part to the last operation.
The fourth operation has one welder, one conveyor, three work stations and three operators who will finish assembling the parts and perform various tests accordingly.
OPPORTUNITY
The current line design was not finalized and had not been tested to see if it was able to meet customer demands in terms of volume, cost, and quality. Hence, there was a need to simulate the different operations to identify any design problems, equipment utilization, headcount and overall throughput capacity.
APPROACH
The data and layout provided by the client was imported to SIMUL8®. The four different operations were included in the model. An Excel® interface was created to input data for the simulation model. This unique technique by PMC allowed the client to have the flexibility of changing most of the inputs for the simulation directly from the Excel® interface, reducing the modeling.
SOLUTION
The discrete-event simulation model successfully and accurately determined the overall throughput capacity of the given production line design as well as the utilization of the different operators and equipment. Using the results from the baseline model, process improvements were made to the original production line. These improvements were then tested by running the simulation model for multiple scenarios. The results were used to find the best configuration that would maximize the overall throughput capacity and reduce the headcount.
BENEFIT
In addition to the simulation study, an Excel® interface was provided to the client for making changes to the operation times, which will allow them to run what-if scenarios in case the process specifications change. Additionally, by using the simulation model to test different layout and process configurations, the client reduced the headcount by one and the number of tools used on the last operation by two. Furthermore, the client also found the best way to use its resources and maximize the line production capacity. The ROI on this project was 10 times the amount invested on the simulation study.