
PMC Case Study | Time & Motion and Traffic Flow Analysis for Optical Retail

June 8, 2021
PMC Case Study | Time & Motion and Traffic Flow Analysis for Optical Retail

Stephanie Sobieski |
Project Summary
A major optical retailer was concerned with their scheduling method, based primarily on sales dollars. They were interested in developing a more accurate, nimble, and demand-driven scheduling technique because the current method was not proven to be the most accurate. The first step toward this strategic goal was to perform a time and motion study to measure the workload. Another focus was to do some detailed analysis on the flow of traffic into the stores and to determine the amount of hours required to operate a store based on the workload.
System Description
A store was composed of three departments: retail floor, laboratory, and doctor’s office. Regardless of the department, resources were allocated by sales dollars. This methodology may be sufficient for departments that are very sales-dependent; however the laboratory is not.
Each store is equipped with an automated traffic counter at the entrance. This device counts every time the beam is broken. This method makes it difficult to form conclusions based on this data because items such as party size, associates entering the store, customers crossing the beam several times, etc. are unaccounted for.
Opportunity
There were two concerns with regard to the time and motion portion of the study. First, were enough hours being allocated to provide the appropriate service levels? This concern was particularly acute with regard to the retail floor. One reason for this concern was the fact that several services not generating any immediate sales were offered (i.e. adjustments, repairs, etc.). Therefore, required work may have had no hours allocated to it. The other, more strategic, concern was whether or not sales dollars was the appropriate workload driver for the three departments.
Store performance is typically measured by the sale conversion rate. A main input to the conversion rate is the traffic count. For this reason, a better understanding of how the traffic flow converts to sales was clearly of vital importance.
Approach
PMC utilized random sampling to measure the workload within each store. The study encompassed one business cycle across twelve different stores. A business cycle was defined as a seven day period, all hours of operation, plus the opening and closing activities of associates.
PMC collected traffic data semi-automatically. An analyst would manually count and categorize inbound traffic and record it in a database with a time stamp. This data can be separated by store, day of the week, time of day, etc. This data was instrumental in determining the “true” conversion rate since it eliminated noise associated with the automated traffic counter.
Solution
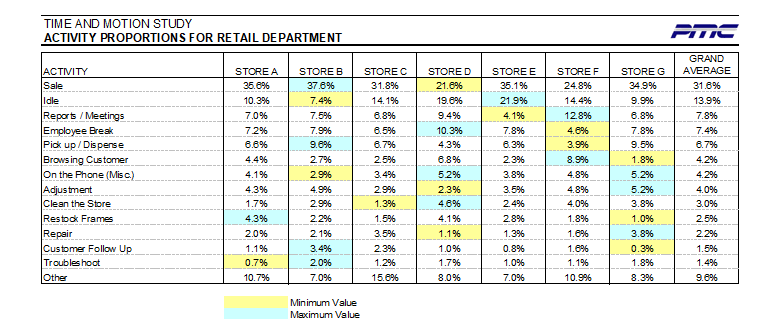
Random sampling data was used to determine how associates spend their time (see table on following page) and to develop standard times for tasks. The frequency of tasks was used to determine the work content for a store. This data is used to develop demand-driven schedules. The data also revealed that using sales dollars as the workload driver for laboratory activities was less accurate than using items produced because the work performed in the laboratory is not driven by sales dollars; it is driven by the number of items produced.
The traffic flow analysis was used to define and quantify all patterns of traffic flow potentially useful in the scheduling of associates. Many of the browsing/buying customers came on the weekends, implying these shifts should include more sales associates. The traffic flow was also used to determine the actual sales conversion rate based only on the number of browsing/buying customer arrivals. This information was vital for the stores managers to verify that they have the appropriate staffing levels at the appropriate days and times. This would minimize the staff’s idle time, which was significant in some stores, and improve customer service during periods of peak demand.
Benefit
PMC provided the workload data required to support a demand-driven scheduling system and performed several detailed analyses on this data which determined the ideal hours required to operate a store. This data can be used to ensure the appropriate service level is achieved; without under or overstaffing. Also, using the traffic flow data, the right classification of associates are scheduled to perform the services required.
Several process improvement opportunities were identified and detailed solutions were presented. Some of these ideas came in the form of best practices from the elite stores while others were derived from the application of lean principles in order to reduce waste. The areas that benefited from process improvements were loss prevention, customer satisfaction, productivity, and sales and marketing.
Let our experts show you how our Services can support your projects!
Stephanie Sobieski
You may also like
Scan-to-Twin for Warehouse Operations: Turning Storage Locations into Real-Time Digital Assets
John Tauchus | March 30, 2026

Scan-to-Twin: Converting an Outdated Asset Database into a Decision-Ready Digital Twin
John Tauchus | March 12, 2026

Comprehensive Steel Design & Detailing for a 10,000+ ft Automotive Conveyor System
Erica Smith | June 25, 2025

Capacity Study Using FlexSim and Layout Design for Consumer Goods Company
Erica Smith | June 10, 2025

Evaluation of Material Handling and Ergonomics in a University Hospital Network
Erica Smith | March 17, 2025
