Simulation Improves Operations at a Specialized Takeout Restaurant
Sapthagirishwaran Thennal Sivaramakrishnan, Shanmugasundaram Chandrasekaran, Jennifer Dhanapal, Paul Ajaydivyan Jeya Sekar, Edward J. Williams
Decision Science, College of Business University of Michigan – Dearborn Fairlane Center South, 19000 Hubbard Drive Dearborn MI 48126, USA
KEYWORDS
Restaurant operations, discrete-event process simulation
ABSTRACT
For more than half a century now, discrete-event process simulation has repeatedly proved itself a powerful analytical tool for improving many types of commercial and industrial processes. This analytical power is especially highly valued when the operational complexity and/or stochastic variability of the process exceeds the ability of closed-form equations to model it. Historically, simulation first proved its worth, and was most extensively used, in the analysis and improvement of manufacturing operations. More recently, the use of simulation has expanded vigorously and broadly to include warehousing operations, the delivery of health care (hospitals and clinics), transportation services (airlines, railroads, and bus lines), and the hospitality industry (amusement parks, hotels, restaurants, and cruise ships).
In the successful simulation application described in this paper, simulation was used to model, analyze, and improve the staffing levels and operational procedures of a restaurant – unusually, a restaurant which provides only take-out services, with (by business choice) no “dine-in” capacity. The simulation analysis showed the most effective path to correction of insufficient capacity, distressingly long waiting times, and consequent lost sales and revenue.
INTRODUCTION
Historically, the first vigorous commercial uses of discrete-event process simulation were in the manufacturing sectors of the economy processes (Law and McComas 1999). More recently, and now very aggressively and successfully, simulation analysts and industrial engineers have expanded its use to warehousing, the delivery of health care, the operation of transportation networks, and the delivery of consumer services. These consumer services are wide- ranging, including the operation of retail stores, banks, hotels, and restaurants. Hotels and restaurants are two of the key sectors in the “hospitality industry;” (Starks and Whyte 1998) provides a tutorial on the use of simulation in this industry, with emphasis on the study of fast-food restaurants. At a more detailed level, (Brann and Kulick 2002) describes the simulation of restaurant operations, and (Curin et al. 2005) describes the successful use of simulation to reduce service times at a busy fast-food university campus restaurant. The focus of analysis in the present study was likewise a restaurant, specifically one providing take-away dinners but offering no dine-in services. The restaurant owners and managers embraced the use of simulation to explore solutions to long-standing problems of inadequate staffing, resulting long waiting times for order pick-up, customer dissatisfaction, and ultimately lost sales.
This paper is organized as follows: The next section provides a high-level description of the restaurant’s operations. The following two sections explain, in turn, the collection and analysis of the input data; and then the construction, verification, and validation of the simulation model. The next section describes the results and conclusions obtained by experimentation runs of the model. The final section presents overall conclusions, how the results specifically guided and helped the restaurateur, and indicated future work.
OVERVIEW OF THE RESTAURANT’S OPERATIONS
The restaurant in question, Veggie Delight, is located near the center of one of south India’s most populous and busy cities, Chennai. Its highly successful business model is to serve takeout only, during the dinner pickup hours (6pm to 10pm, although orders accepted before 10pm may perforce be picked up shortly after that hour), and to serve only one famous south Indian dish, idli (south Indian rice cake) with chutney (a family of condiments – hence this is a vegetarian entrée) (Achaya 2012). No diners are served within the restaurant itself. All orders are taken by telephone; the typical customer telephones the dinner order from his or her workplace, then intending to drive by the restaurant on the way home and pick up the boxed dinner for leisurely home consumption. A surge of telephone calls begins immediately after the 6pm opening time, and continues unabated through the evening, as workers head home from often late working hours in nearby offices. Indeed, the restaurant proprietors might say the business model has become too successful – leading to overload of the cooks and the kitchen capacity, hence long wait times, impatient customers, and hence complaints and lost sales. Many of the analytical challenges presented by this business context were strikingly similar to those presented by the simulation of an oil change center (Williams et al. 2005). In both contexts, the customer service was provided on a basis of “drive in, receive needed service (the provision of fresh oil or a boxed dinner), and drive out.” In both businesses, the most pressing problems related to staffing levels and the deployment of personnel. In the case of this restaurant, when the simulation study began, there were two workers – one dedicated to answering the telephone and one working to cook and package the idlies – and four telephone lines. And both simulation clients expressed the heartfelt concern “The line is so bad it’s out into the street.”
Confronting challenges such as these, the restaurant management sought to determine the potential improvements to key performance metrics which could be obtained by increasing the number of incoming telephone lines and/or the number of culinary workers. The key performance metrics were:
- Rejected (“dropped”) incoming telephone orders per hour
- Utilization of the kitchen workers
- Customers’ time-in-system
- Average number of waiting customers, and their average waiting time
- Number of customers served
INPUT DATA AND ITS ANALYSIS
Since the restaurant is a specialized one which opens each day at 6pm (to cater to the dinner trade) and closes shortly after 10pm (when the last customer arriving before 10pm has received full service), data collection was not unduly burdensome in terms of time required. On multiple days, distributed among the days of the week, the modeling team collected – by direct observation – data pertaining to the number of incoming calls received and answered per hour, the time required to answer a call, the number of idlies ordered in a call, the time required to prepare idlies, and the time required to package them for handover to the arriving customer. It was readily observed that the packaging of cooked idlies was not a bottleneck of concern. The restaurant has telephone lines scrupulously kept available for incoming calls (employees are not allowed to use these lines to place an outbound call). The italicized words above (“and answered”) acknowledge an admitted deficiency of this data collection: If a would-be customer places a call when all deployed lines are already receiving orders, that customer will receive a busy signal and the failure of that call goes undetected. These data were analyzed with the commonly used and reliable distribution-fitting software Stat::Fit®. Appropriate techniques of using a software package for this purpose appear in (Chung 2004). The Stat::Fit® software supports the chi-squared, Kolmogorov- Smirnov, and Anderson-Darling measures of fit quality, as documented in a description of this software which appears in (Leemis 2002).
Results of these analyses led to the following conclusions:
- Call interarrival times (for calls successfully received) were exponentially distributed with mean six minutes.
- Time taken to answer a customer call was uniformly distributed between two and two and a half minutes.
- The time required by the kitchen to prepare an idli was triangularly distributed with minimum seven minutes, mode eight minutes, and maximum nine minutes.
- The time required to pack one, two, or three idlies in a box (a box holds a maximum of three idlies) was triangularly distributed with minimum 30 seconds, mode 48 seconds, and maximum 60 seconds.
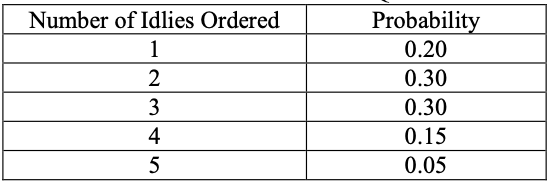
The number of idlies ordered was distributed as follows:
Probabilities of Ordered Quantities
The number of idlies ordered was found independent of time of evening and independent of day of week. Therefore, in the model, a customized discrete distribution was defined to represent these probabilities.
No significant downtimes of equipment, nor absenteeism problems of workers, were noticed during the data collection period. Therefore, no such downtimes or personnel shortages were incorporated into the simulation model. Furthermore, the success the staffing increase (two more workers) achieved when implemented convinced the restaurateur to use simulation analysis again to evaluate contingency plans addressing the quantitative effects of unexpected absenteeism, equipment failure, or electrical failure (this last a highly pertinent concern, especially during the rainy season when frequent power outages are quite likely).
MODEL CONSTRUCTION, VERIFICATION, AND VALIDATION
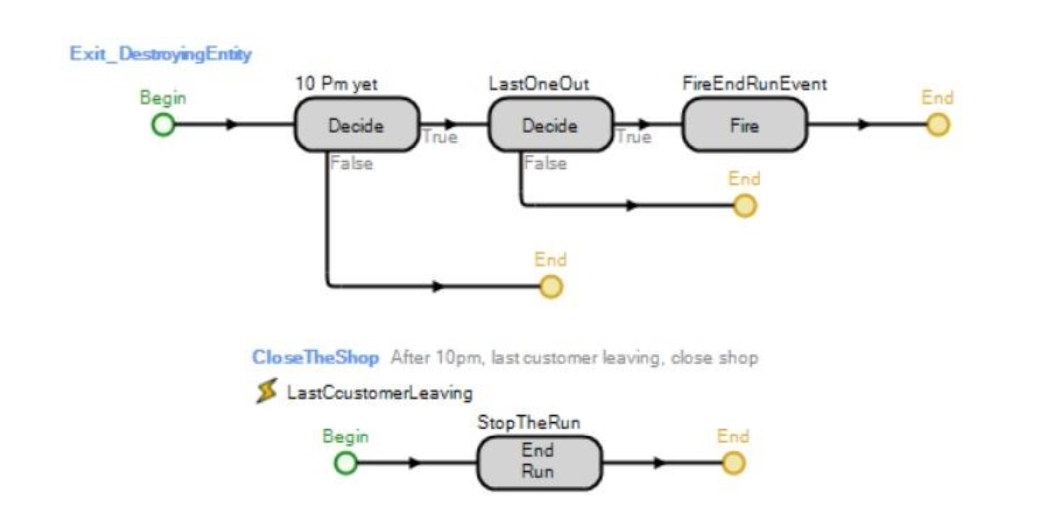
The simulation software tool Simio®, well documented in (Kelton, Smith, and Sturrock 2013), (Joines an Roberts 2015), and (Thiesing and Pegden 2015), was used for this project. Simio® constructs such as Servers (representing the cooking or the packing stations), Sources (representing arrival of either incoming calls or of customers “physically” arriving to pick up orders), Sinks (representing calls or customers leaving the system), and Resources (representing cooks or packers) were well-suited to model the process. Entities moving through this model represented incoming calls, arriving customers, or idlies being cooked, packaged, and delivered to customers. Model logic using entity attributes (which Simio® calls “states”) ensured the delivery of an order of idlies to the customer who placed the order by telephone. Commendably, Simio® supports the development of model logic via a “drag-and-drop” flowchart-construction interface in lieu of the writing of code in a software language (typically akin to Visual Basic for Applications). This support helps make simulation analysis to graduate-level business students, who – in the United States – typically do not have a background in computer coding in a language such as VBA or C++. An example showing the logic executed upon the acceptance of an order appears as Figure 1 in the Appendix. Similar logic ensures that no incoming calls can enter the system after 10pm – but orders received previously will move through the system until fulfillment and the “last order out” will “close” the restaurant.
Various techniques (Sargent 2015) were used to verify and validate the model. These techniques included:
- Sending one arriving order (followed by one arriving customer to pick it up) through the system and tracing it step-by-step via the animation. The order and customer entities proceeded through the model correctly, including successful matching of the Customer entity with the Order entity, at the“Delivery” point (which Simio® calls a “Combiner”).
- Directional testing – for example, increasing or decreasing the frequency of incoming calls beyond plausible limits and checking that performance metrics such as resource utilizations increased or decreased as expected. For example, at the “Kitchen” (a “Server” in Simio® nomenclature) queues grew steadily as incoming call rates increased – until the utilization of call lines reached 100%.
- Undertaking structured walkthroughs of process logic within the modeling team.
- Checking (via display of the state variable “number of entities in system” on the animation) that this number decreased monotonically after 10pm.
- Reconciling the total number of idlies cooked and delivered with the number of customers served and the distribution of “idlies ordered per customer” as specified in Table 1. For example, as test run specifying that exactly 100 customers would enter the system should lead to an expectation of selling 255 (20*1 + 30*2 + 30*3 + 15*4 + 5*5) idlies; several such test runs all predicted sales of between 241 and 266 idlies).
At the conclusion of these verification and validation endeavors, and the routine correction of mistakes exposed by these efforts, the simulation model was deemed valid and acknowledged as credible by the restaurant proprietor. Specifically, all performance metrics of high interest (number of customers served, number of idlies cooked and delivered, time-in-system of incoming calls, and utilizations of cooks and packers) matched current observations in the restaurant to within 4%.
RESULTS OF THE SIMULATION MODEL
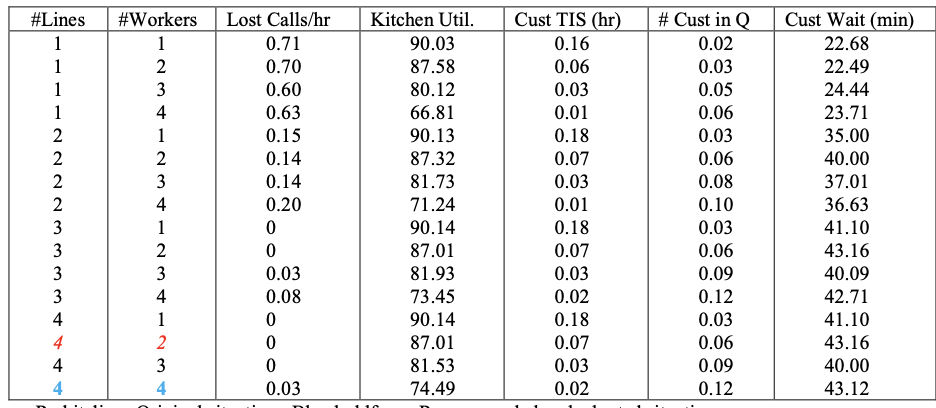
Since the restaurant opens afresh every day at 6pm and runs until “empty and after 10pm,” simulation runs were terminating, not steady-state, and hence needed zero warm-up time. Each of sixteen scenarios (one to four telephone lines and one to four workers) was run for twenty replications.
Originally, the restaurant had four telephone lines and two workers. After examining the simulation results, the proprietor decided to add two workers and correspondingly increase space in the kitchen. Doing so, at moderate cost, provided the following reassurances:
- Kitchen utilization would decrease from a frenetic 87% to a relatively comfortable but not wasteful 74%-75%.
- A fivefold increase in customers could be accommodated with unchanged customer waiting time. This reassurance was of particular significance to the restaurateur because new construction of office buildings in the neighborhood is likely to provoke a sharp increase in the number of office workers wishing to order a takeout dinner as they prepare to commute home from work.
- The time-in-system of a customer (from the customer’s perspective, “How soon after calling my order will it be ready?”) would be less than 1⁄3 its previous value.
- The number of customers served on average increased from 40.55 to 45.00, a 10% increase.
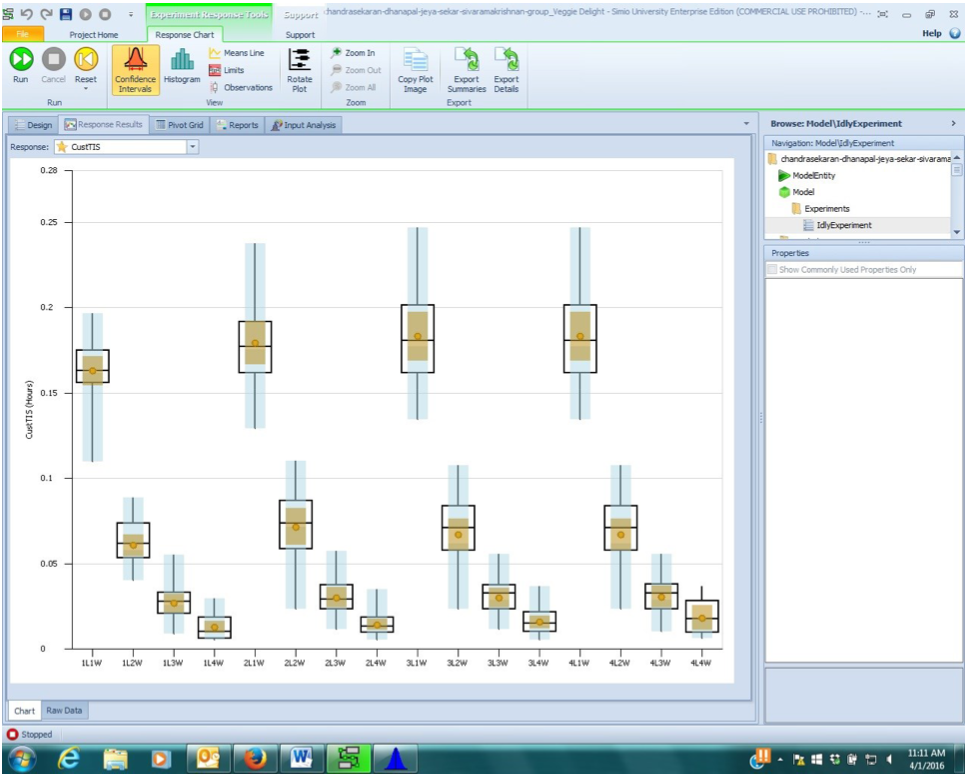
Details of these simulation results appear in Table 2 (Appendix). The box-&-whisker plot (Figure 3), very easily and conveniently available in Simio®, helps a non-technical client, such as the proprietor, readily understand the merits of the sixteen different scenarios studied relative to the performance metrics (here, customer time in system).
In view of these considerations, the proprietor did adopt this change and successfully realized these benefits, supporting a rapid and profitable increase in business. Financially, the cost of increased capacity was 10.000 Rs. (one time), the cost of the two incremental workers was 8.200 Rs./month, and overall profit increased by Rs. 169.000, a nearly nine-fold return on investment.
CONCLUSIONS AND FURTHER WORK
This simulation project and its analysis provided valuable advice and reassurances to the restaurateur. Deliberate inclusion of a large number of scenarios – many of which were deliberately leaner in staffing levels than the current situation – helped convince the restaurateur that the operations were most emphatically not overstaffed, and added to the credibility the model and its analysis achieved. Furthermore, the successes of increasing total customers served by 10% while keeping the number of dropped calls negligible and not increasing customer waiting time have encouraged the business proprietor to consider potential expansions of the enterprise.
ACKNOWLEDGMENTS
The authors gratefully acknowledge timely support from the company Simio LLC as various technical questions arose during the course of this project. Also, helpful criticisms from three anonymous reviewers have enabled the authors to make meaningful improvements to the organization and presentation of the results of this study.
REFERENCES
Achaya, K. T. 2012. The Story of our Food. India: Universities Press Private Limited.
Brann, David M. and Beth C. Kulick. 2002. Simulation of Restaurant Operations Using the Restaurant Modeling Studio. In Proceedings of the 2002 Winter Simulation Conference, Volume 2, eds. Enver Yücesan, Chun-Hung Chen, Jane L. Snowdon, and John M. Charnes, 1448- 1453.
Chung, Christopher A. 2004. Simulation Modelling Handbook. Boca Raton, Louisiana: CRC Press.
Curin, Sara A., Jeremy S. Vosko, Eric W. Chan, and Omer Tsimhoni. 2005. Reducing Service Time at a Busy Fast Food Restaurant on Campus. In Proceedings of the 2005 Winter Simulation Conference, eds. Michael E. Kuhl, Natalie Steiger, Frank Armstrong, and Jeffrey A. Joines, 2628-2635.
Joines, Jeffrey Allen and Steven Dean Roberts. 2015. Simulation Modeling with Simio: A Workbook, 4th edition. North Charleston, South Carolina: CreateSpace Independent Publishing Platform.
Kelton, W. David, Jeffrey Smith, and David Sturrock. 2013. Simio and Simulation: Modeling, Analysis, Applications, 3rd edition. Learning Solutions.
Law, Averill M. and Michael G. McComas. 1999. Simulation of Manufacturing Systems. In Proceedings of the 1999 Winter Simulation Conference, Volume 1, eds. Phillip A. Farrington, Harriet Black Nembhard, David T. Sturrock, and Gerald W. Evans, 56-59.
Leemis, Lawrence M. 2002. Stat::Fit: Fitting Continuous and Discrete Distributions to Data. In OR/MS Today (29,3) [June].
Sargent, Robert G. 2015. An Introductory Tutorial on Verification and Validation of Simulation Models. In Proceedings of the 2015 Winter Simulation Conference, eds. L. Yilmaz, W. K. V. Chan, I. Moon, T. M. K. Roeder, C. Macal, and M. D. Rossetti, 1729-1740.
Starks, Darrell W., and Todd C. Whyte. 1998. Tutorial: Simulation in the Hospitality Industry. In Proceedings of the 1998 Winter Simulation Conference, Volume 1, eds. D. J. Medeiros, Edward F. Watson, John S. Carson, and Mani S. Manivannan, 37-39.
Thiesing, Renee M. and C. Dennis Pegden. 2015. Introduction to Simio. In Proceedings of the 2015 Winter Simulation Conference, eds. L. Yilmaz, W. K. V. Chan, I. Moon, T. M. K. Roeder, C. Macal, and M. D. Rossetti, 4090-4099.
Williams, Edward J., Justin Clark, Renée M. Amodeo, and Jory D. Bales Jr. 2005. Simulation Improves Staffing Procedure at an Oil Change Center. In Proceedings of the 19th European Conference on Modelling and Simulation, eds. Yuri Merkuryev, Richard Zobel, and Eugène Kerckhoffs, 309-314.
AUTHOR BIOGRAPHIES
SAPTHAGIRISHWARAN THENNAL SIVARAMAKRISHNAN is pursuing his master’s in business analytics, majoring in information management and coordination analytics. He holds a master of business administration from VIT University, Vellore, India. He earned his bachelor’s in computer science and engineering from Jerusalem College of Engineering (Anna University), Chennai, India. From 2011 to 2013, he worked as a software engineer for HCL Technologies Limited where his role was to develop and customize software as well as perform base product migration for the U.S.-based pharmaceutical customers. During his tenure with HCL, he worked for the clients CSL Behring LLC and Eisai Incorporated. He works at ILABS, the center for innovation research, University of Michigan – Dearborn as a graduate research assistant where he is conducting data analysis for the College of Arts, Sciences and Letters (CASL) to unleash hidden insights. He is also the webmaster of the Information Technology Management (ITM) club at his university. His email address is [email protected].
SHANMUGASUNDARAM CHANDRASEKARAN
pursued his Master’s in Business Analytics majoring in Information Management & Coordination Analytics. He holds a Master of Business Administration degree from VIT University, Vellore, India. He earned his Bachelor’s in Electronics and Communication Engineering from K.S. Rangasamy College of Technology (Anna University), Tamilnadu, India. From 2012 to 2013, he held a position as placement coordinator for the ECE Department, K.S. Rangasamy College of Technology where his role was to coordinate group activities related to placement and help students to achieve job placement in highly regarded companies. He works at Petrofac Engineering Service Private Limited as a management intern where he has proposed a few changes in the project change management of the ERP Systems, to improve their processes. In 2013, he published a paper “Sensor Network Based Dyeing Industry Monitoring and Controlling System” in the International Journal of Teacher Educational Research (IJTER). In 2011, he won first prize for his paper “Cellphone the Life Saver,” presented in Alagappa College of Technology, Tamilnadu, India. His email address is [email protected].
JENNIFER DHANAPAL is a graduate student in supply chain management enrolled with the College of Business at the University of Michigan-Dearborn. Prior to this she studied business administration as her first graduate degree program at VIT University, India. Her bachelor’s degree was in commerce and finance from the University of Madras, India. She has extensive experience in quality assurance and data accuracy, having worked with Frost & Sullivan undertaking consulting and market research. She also has experience working in production and operations with auto manufacturer Royal Enfield. She was instrumental in the automation process of materials costing and helped in improving the efficiency of the procurement system. She is a student member of American Production and Inventory Control Society (APICS) and won third prize in the 2015 Great Lakes supply chain case solving competition organized by APICS. Her email address is [email protected].
PAUL AJAYDIVYAN JEYA SEKAR is a graduate student in supply chain management enrolled with the college of business at the University of Michigan- Dearborn. He holds a master of business administration degree from VIT University, Vellore, India. He earned his bachelor’s degree in technology from Kalasalingam University, Virudhunagar, India. He published an international paper on nanotoxicity at Christ College, Kerala and conducted international knowledge carnival-gravitas 2013 at VIT University. He also did his internship at Saint Gobain-Weber studying the brand penetration of a new product that has been launched and negotiated with the purchasing decision of top management. He is a student member of the American Production and Inventory Control Society (APICS). His email address is [email protected]
EDWARD WILLIAMS holds bachelor’s and master’s degrees in mathematics (Michigan State University, 1967; University of Wisconsin, 1968). From 1969 to 1971, he did statistical programming and analysis of biomedical data at Walter Reed Army Hospital, Washington, D.C. He joined Ford Motor Company in 1972, where he worked until retirement in December 2001 as a computer software analyst supporting statistical and simulation software. After retirement from Ford, he joined PMC, Dearborn, Michigan, as a senior simulation analyst. Also, since 1980, he has taught classes at the University of Michigan, including both undergraduate and graduate simulation classes using GPSS/H, SLAM II, SIMAN, ProModel, SIMUL8, or Arena®. He is a member of the Institute of Industrial Engineers [IIE], the Society for Computer Simulation International [SCS], and the Michigan Simulation Users Group [MSUG]. He serves on the editorial board of the International Journal of Industrial Engineering – Applications and Practice. During the last several years, he has given invited plenary addresses on simulation and statistics at conferences in Monterrey, México; İstanbul, Turkey; Genova, Italy; Rīga, Latvia; and Jyväskylä, Finland. He served as a co-editor of Proceedings of the International Workshop on Harbour, Maritime and Multimodal Logistics Modelling & Simulation 2003, a conference held in Rīga, Latvia. Likewise, he served the SummerComputer Simulation Conferences of 2004, 2005, and 2006 as Proceedings co-editor. He was the Simulation Applications track coordinator for the 2011 Winter Simulation Conference. A paper he co-authored with three of his simulation students won “best paper in track” award at the Fifth International Conference on Industrial Engineering and Operations Management, held in Dubai, United Arab Emirates, in March 2015. His email addresses are [email protected] and [email protected].
APPENDIX

Process Logic Executed When Order is Taken
Your Partner in Productivity Improvement
Want to speak with one of our Industrial Engineering, Reality Caputre, or Simulation Experts? Contact us via the form below!
We look forward to helping you achieve your goals.
Recent posts
